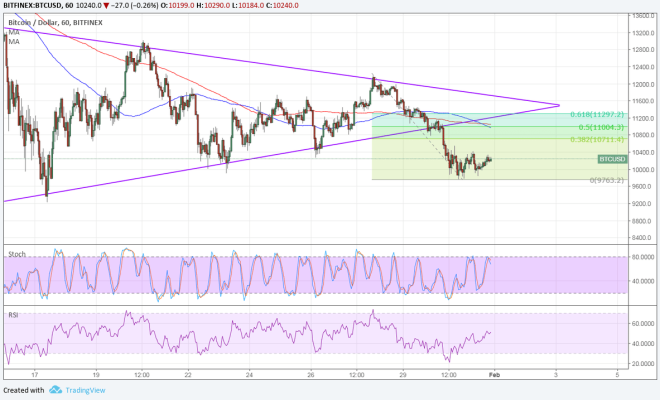
Bitcoin Price Key Highlights
- Bitcoin price recently broke below its symmetrical triangle pattern an hit a low of $9,763.20.
- Price seems to be finding some support from here, so a pullback opportunity may be underway.
- Applying the Fib tool on the breakout move shows the potential resistance levels.
Bitcoin price made a bearish breakout from a consolidation pattern, but a correction seems imminent to the nearby Fib levels.
Technical Indicators Signals
The 100 SMA is crossing below the longer-term 200 SMA to confirm that bearish momentum is picking up. In addition, these moving averages are close to the broken triangle support to add to its strength as potential resistance from here.
This also coincides with the 50% retracement level around $11,000. A higher pullback could last until the 61.8% Fib at $11,297.20. After all, RSI has some room to climb, so bitcoin price might follow suit.
Stochastic seems eager to fall even without hitting overbought conditions, which suggests that bearish pressure could return soon. The current consolidation does look like a flag as well.

Market Factors
The slight bounce in bitcoin price was attributed by many to profit-taking activity at the end of the month. But the lack of major positive catalysts kept a lid on the move higher and failed to encourage more bulls to join in.
Besides, the US dollar drew some support from the FOMC decision as the central bank kept rates on hold but sounded more optimistic on inflation and future tightening moves. Risk appetite peeked back in the financial markets as well, reviving demand for stocks and commodities.
As it is, bitcoin continues to face increased scrutiny from regulators, giving more time for bearish commentary to influence investors’ decisions as well. Apart from that, there are some businesses that are also showing doubts about the cryptocurrency. Then again, keep in mind that bitcoin price has historically fallen for January for the past few years before regaining traction much later on.