Bitcoin Price Key Highlights
- Bitcoin price is trending lower on its 4-hour time frame but is bouncing off support.
- A pullback to the channel resistance could be underway, but there are also nearby inflection points.
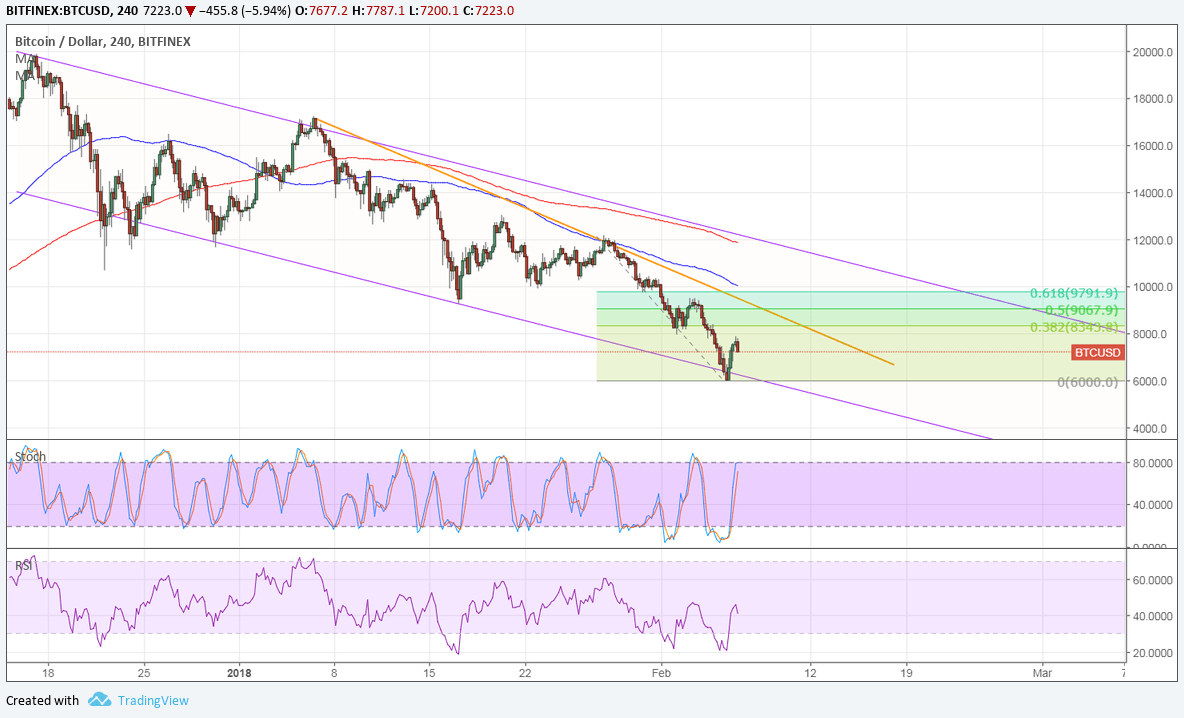
- In particular, a descending trend line connects the highs since the start of the year and lines up with Fib retracement levels.
Bitcoin price continues to trend lower but is in the middle of a correction, possibly to the long-term channel resistance or a short-term falling trend line.
Technical Indicators Signals
The 100 SMA is below the longer-term 200 SMA on this time frame to confirm that the path of least resistance is to the downside. This means that the selloff is more likely to persist than to reverse. The gap between the moving averages is widening to reflect increased selling pressure.
In addition, the 100 SMA lines up with the short-term descending trend line to add to its strength as a ceiling. This is also in line with the 38.2% Fibonacci retracement level around $8,000.
Stochastic is still pointing up to show an increase in buying pressure, though, while RSI has more room to climb so bitcoin price could follow suit. A larger correction could last until the 200 SMA dynamic inflection point right in line with the channel top.

Market Factors
Risk appetite recovered somewhat in the financial markets as equities pulled up from a steep single-day drop to close in the green. This also allowed cryptocurrencies to rebound, although its also evident that there was a lot of buy orders waiting at key support zones.
Looking ahead, the focus could still be on market sentiment and how it relates to global tightening expectations. This could have a strong influence on bitcoin price action from here since there are no major catalysts driving cryptocurrencies around.
Then again, it’s important to note that bitcoin remains under pressure from stricter scrutiny by regulators and a number of financial institutions. It would take a significantly positive catalyst to shore it up once more while investors are feeling wary about bans or glitches.