Bitcoin Price Key Highlights
- Bitcoin price is still rallying and has broken one resistance level after another.
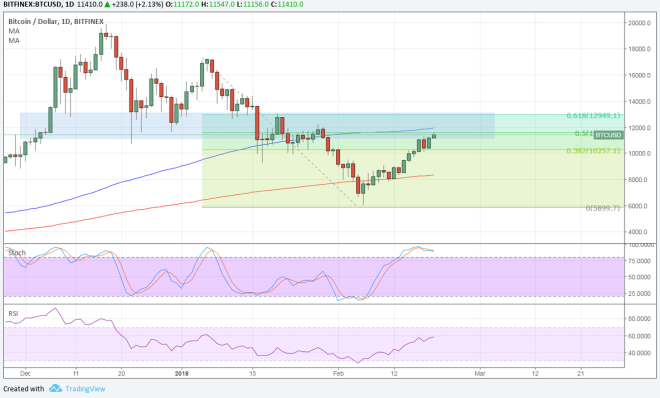
- Zooming out to the daily time frame reveals that price is closing in on a major area of interest.
- Applying the Fibonacci retracement tool on the daily swing high and low shows that this potential ceiling lines up with the 61.8% level as well.
Bitcoin price could pause from its climb once it tests the next area of interest visible on the daily chart.
Technical Indicators Signals
The 100 SMA is above the longer-term 200 SMA on this long-term time frame, so the path of least resistance is to the upside. This suggests that the rally is more likely to continue than to reverse.
However, the 100 SMA dynamic inflection point lines up with the area of interest to add to its strength as a potential barrier. Then again, the gap between the moving averages is widening to reflect stronger bullish momentum.
Stochastic is indicating overbought conditions on this time frame, though, so selling pressure could return soon. In addition, a bit of bearish divergence can be seen as price made lower highs while stochastic had higher highs.
RSI has some room to climb before hitting overbought levels, which means that buyers can stay in the game for a bit longer, possibly even leading to a move past the area of interest.

Market Factors
Sentiment has significantly improved in the cryptocurrency industry, allowing bitcoin price to sustain its recent rallies. This is seen to have stemmed from the US Senate hearing encouraging developments in the industry, followed by positive remarks from South Korean officials over the previous weekend.
Other nations are expected to take a similar stance on bitcoin, although it’s also worth noting that BOE Governor Carney recently commented that it has failed as a store of value.
Dollar price action could pick up and lead to more volatility for BTCUSD as the Fed gears up to release the minutes of its latest policy meeting. Keep in mind that global tightening expectations have been influencing market sentiment and bitcoin price has drawn support from risk-taking.