Bitcoin Price Key Highlights
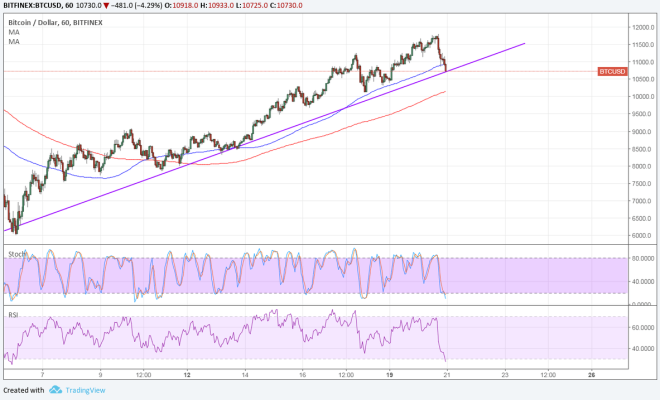
- Bitcoin price sold off from its rising wedge support previously highlighted, signaling that a downtrend may be in order.
- However, price is still testing support at the rising trend line connecting the lows since the start of the month.
- Technical indicators are also suggesting that bullish momentum could return.
Bitcoin price is pulling back from its uptrend and is testing support at an area of interest where buy orders might be located.
Technical Indicators Signals
The 100 SMA is still above the longer-term 200 SMA to confirm that the path of least resistance is to the upside. This means that the uptrend is more likely to resume than to reverse. Also, the 100 SMA lines up with the trend line to add to its strength as a floor.
A break below the trend line could still find a floor at the 200 SMA dynamic inflection point, which is still within the area of interest or former resistance zone around $10,000.
Stochastic is on its way down to show that sellers are on top of the game but the oscillator is dipping into oversold territory. Similarly RSI is in the oversold region to signal that sellers are starting to get exhausted. Turning back up could draw bullish pressure back in and allow bitcoin price to bounce.

Market Factors
The US dollar extended its gains to its counterparts even as US traders returned from the holiday. Risk aversion was in play as equities and commodities closed in the red, which was also bearish for bitcoin price.
Higher US bond yields are being pinpointed as the main factor spurring dollar gains across the board. Today the FOMC minutes are up for release and hawkish remarks could spur tightening expectations, which might even be more bullish for the dollar.
Meanwhile, there are a few more naysayers on bitcoin lately, including BOE head Carney who noted that bitcoin has failed as a store of value. On the other hand, there are a few positive reports, such as the one from India where SBI Cards & Payments Services Pvt. Ltd decided not to ban purchasing bitcoin and other cryptocurrencies with credit cards.