Bitcoin Price Key Highlights
- Bitcoin price is still in correction mode but appears to be bouncing off the trend line support.
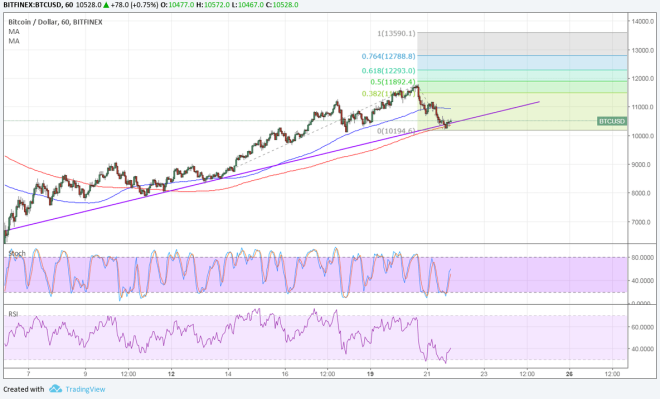
- Applying the Fibonacci extension tool shows how high price could go if the trend line holds.
- Technical indicators are signaling that the uptrend is about to resume.
Bitcoin price is finding support at the area of interest on the trend line, 200 SMA, and $10,000 mark so the rally might resume from here.
Technical Indicators Signals
The 100 SMA is above the longer-term 200 SMA on this time frame so the path of least resistance is to the upside. This means that the rally is more likely to resume than to reverse. Also, the 200 SMA lines up with the rising trend line connecting the latest lows.
Stochastic is pulling up from oversold levels to signal that bullish pressure is returning. Similarly, RSI is also turning higher to show that buyers are ready to jump back in.
A bit of bullish divergence can be seen on stochastic as the oscillator formed higher lows while price had lower lows. A bounce could take bitcoin price up to the 38.2% extension around $11,000 or the 50% extension at the swing highs.
The 61.8% extension is located at $12,000 or another long-term area of interest. The 76.4% extension is at $12,788 then the full extension is at $13,590.

Market Factors
The US dollar enjoyed another wave higher on hawkish FOMC minutes and risk aversion. Policymakers agreed that stronger growth momentum could warrant further tightening in the months ahead.
This led to higher bond yields and another weak close for US equities as business and consumer activity could be dampened by higher interest rates. Note that bitcoin price has been trading alongside stocks and commodities, so the dip also affected the cryptocurrency.
Nonetheless, it’s still worth noting that bitcoin sentiment has improved after a few nations have expressed the need to keep the door open for industry developments. Then again, some top financial officials have made negative remarks on bitcoin, particularly on its ability to be a store of value.