Bitcoin Price Key Highlights
- Bitcoin price has been trending higher on the 1-hour time frame but seems to be hesitating once more.
- Price formed lower highs and higher lows visible on the 15-minute chart, creating a symmetrical triangle consolidation pattern.
- A breakout in either direction could ensue, giving clues about where bitcoin price could head in the long run.
Bitcoin price is consolidating tightly in a symmetrical triangle pattern on short-term charts so a breakout could happen sooner or later.
Technical Indicators Signals
The 100 SMA is above the longer-term 200 SMA for now so the path of least resistance could be to the upside. Also the 100 SMA coincides with the triangle support, adding to its strength as a floor. A larger dip could also bounce off the 200 SMA dynamic inflection. For now, though, the moving averages are oscillating so further sideways action could be seen.
Stochastic seems to be on its way down so sellers are on top of their game. This suggests that a downside break might be more likely than a break higher. RSI is also turning lower so bitcoin price might follow suit. However, both oscillators are on middle ground so another climb to the overbought zone could still be possible.
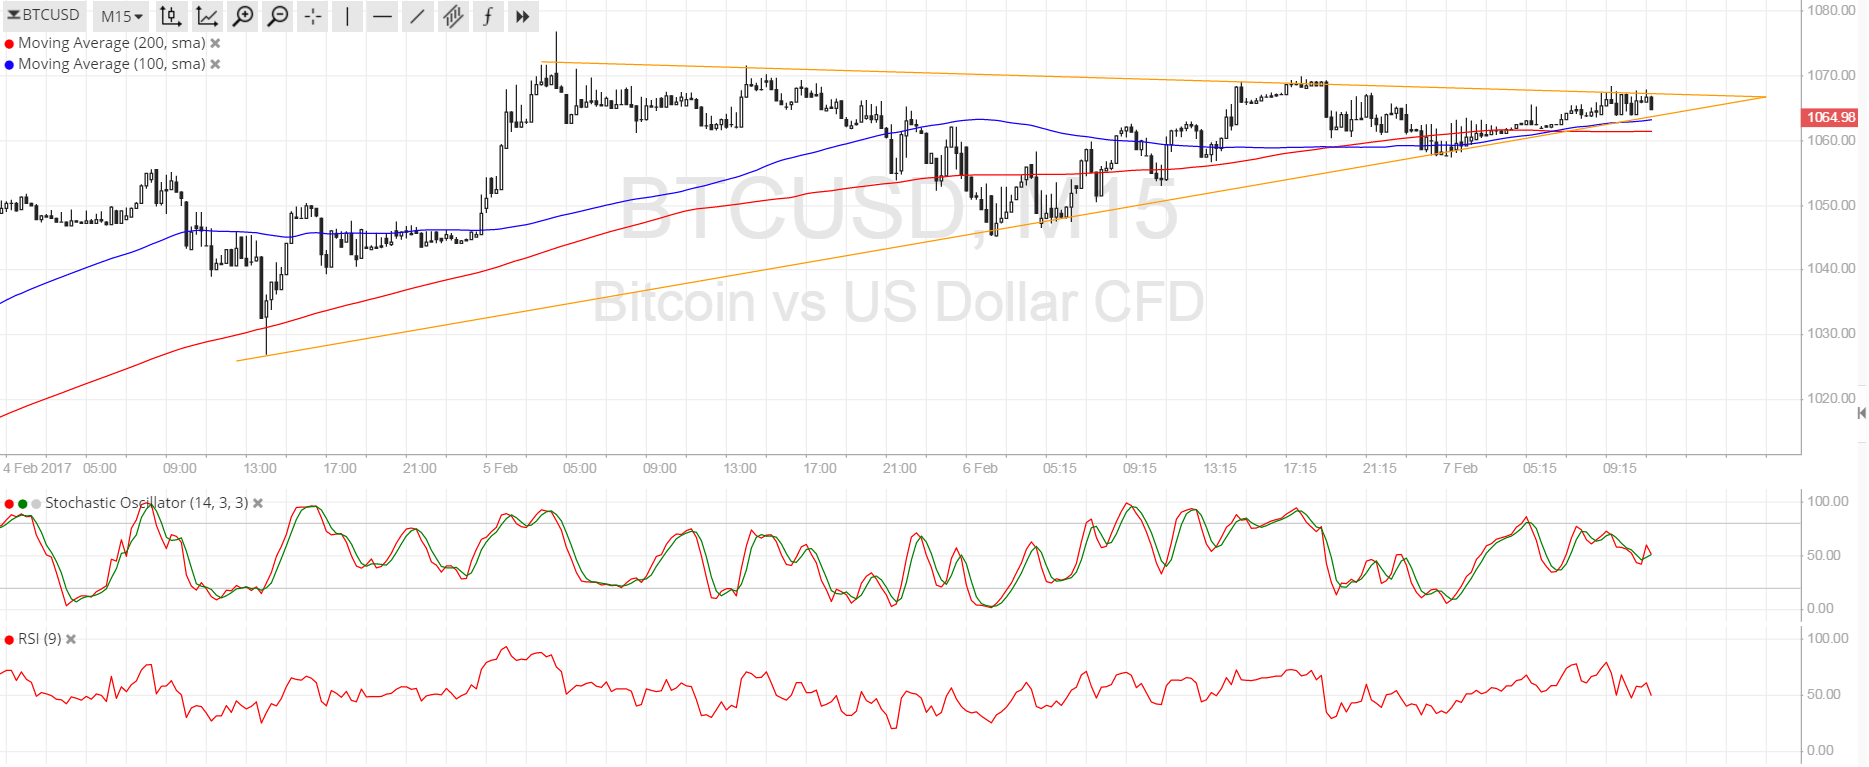

A break past the $1070 level could be enough to confirm that bulls are taking over price action while a move below $1050 could seal the deal for a downside break. The triangle formation spans $1030 to $1070 so the resulting rally or selloff could be of the same size.
Market Events
Risk aversion seems to be popping its head back in the financial markets so the US dollar is regaining some ground. Aside from that, renewed hopes that the Fed can push through with three rate hikes this year is also bullish for the dollar versus bitcoin price. Still, there’s a lot of uncertainty surrounding the US economy due to the Trump administration’s actions, which could still dampen demand for the currency.
Profit-taking off the recent bitcoin price rallies may be also preventing traders from pushing it further north, possibly waiting for more market clues as to whether the trend can continue or reverse.
Charts from SimpleFX