Bitcoin Price Key Highlights
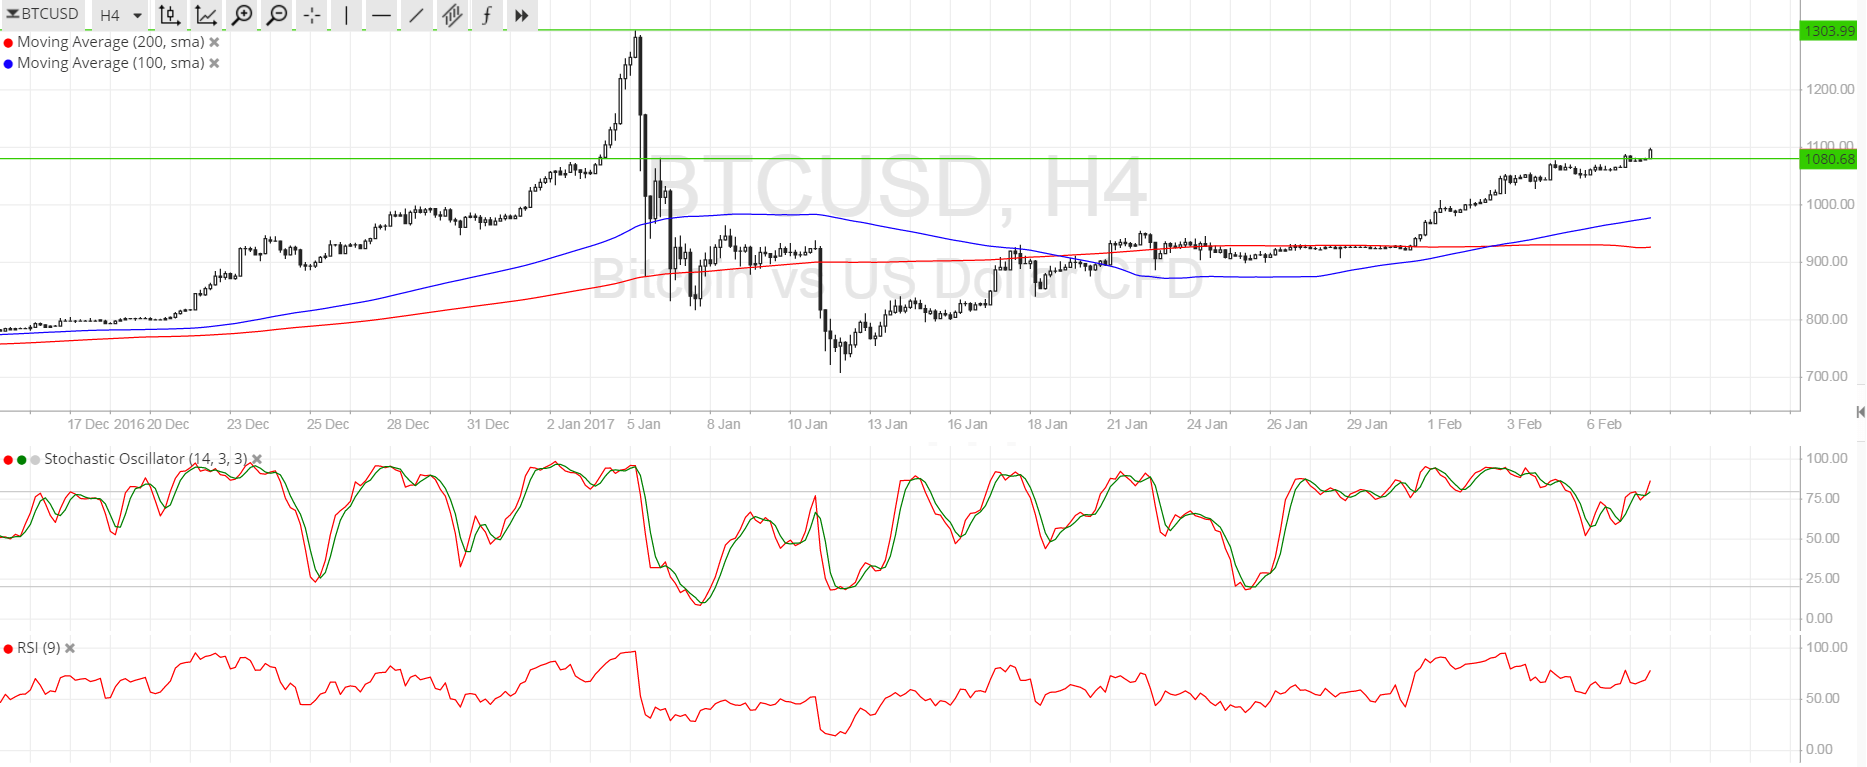
- Bitcoin price continues to rally, taking out one resistance level after another in the past few days.
- Bullish pressure is still strong and seems enough to carry price past the nearby ceiling at $1080-1100.
- In that case, the path is open for a move up to the January highs close to $1300.
Bitcoin price seems to be aiming higher as bulls keep pushing it past one upside barrier after another.
Technical Indicators Signals
The 100 SMA recently crossed above the longer-term 200 SMA on the 4-hour chart, confirming that the uptrend is more likely to carry on than to reverse. The gap between the moving averages is getting wider so buyers are upping the pressure on bitcoin price, possibly enough to keep it supported all the way up to the next long-term resistance.
Stochastic is on the move up, also confirming that bullish momentum is in play. However, the oscillator is nearing the overbought zone to suggest that buyers might book profits soon and let sellers take over.
RSI is also turning up, which means that bitcoin price could have more room to go north. Once the oscillator turns down from the overbought zone, selling pressure could kick in and trigger a pullback. The moving averages could hold as near-term support levels.

Market Events
Risk-taking kicked into high gear once more and the lack of direction in the dollar gave a prime opportunity for bitcoin bulls to take advantage. Economic data from the US came in mostly in line with estimates while the Nasdaq closed at record highs. However, investors continue to shy away from the US currency due to the uncertainty surrounding the Trump administration.
In the meantime, another day without bitcoin crackdown news from China is a good day for bitcoin bulls, giving them enough courage to increase long positioning. Still, stay on the lookout for any updates on government restrictions now that trading activity and volumes are picking up once more.
Charts from SimpleFX