Bitcoin Price Key Highlights
- Bitcoin price volatility has been subdued these days as traders are waiting with bated breath on developments in China.
- A few days back, top exchanges were prompted to halt client withdrawals in compliance with the government’s anti-money laundering crackdown.
- Bitcoin sold off sharply and is now trending lower on short-term time frames.
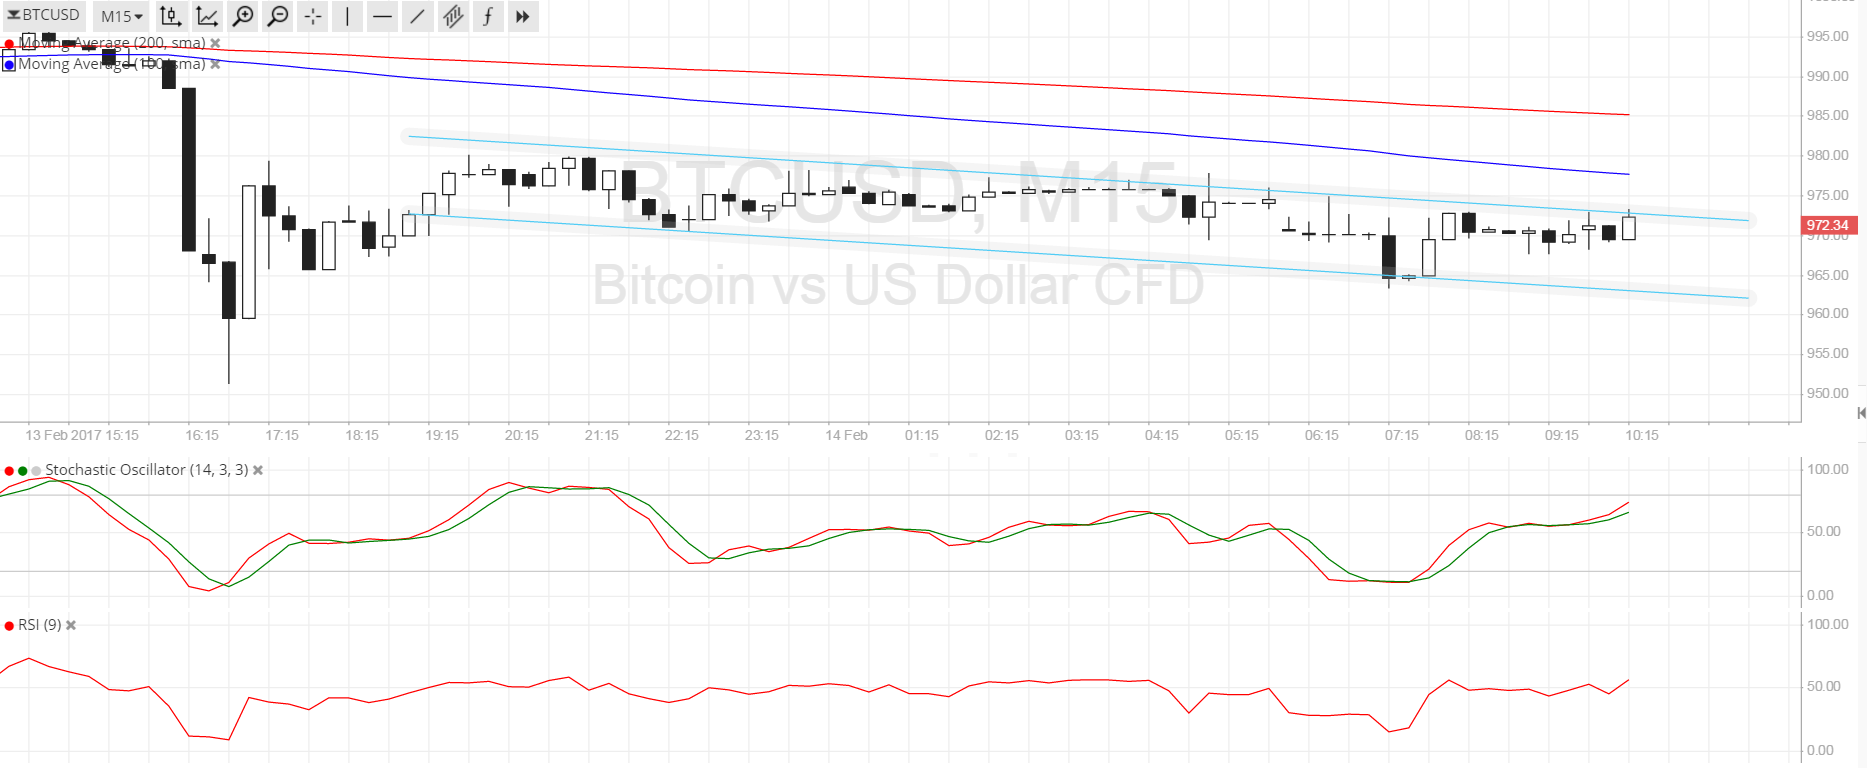
Bitcoin price is moving inside a descending channel on its 15-minute time frame and is currently testing resistance.
Technical Indicators Signals
The 100 SMA is below the longer-term 200 SMA on this time frame so the path of least resistance is to the downside. In other words, the channel resistance at $970 is more likely to hold than to break. In addition, the gap between the moving averages is getting wider, which means that bearish pressure is getting stronger.
Still, an upside break from the channel resistance could draw buyers to the game, perhaps on the relief that Chinese authorities are pausing from their crackdown efforts for the time being. Similar action was seen earlier in the year, as bitcoin price made a strong rebound close to its January highs.
Stochastic is still heading up, which means that there’s still some bullish pressure left. Once the oscillator hits the overbought region and turns lower, sellers could return to the game and push bitcoin price to the channel support at $960. Stronger bearish momentum could lead to a downside break and a test of the lows at $955. RSI is moving sideways but turning slightly higher to suggest a pickup in buying pressure.

Market Events
Risk appetite seems to be returning to the markets after inflation reports from China turned out better than expected. This might drive up demand for higher-yieldings assets like bitcoin versus safe-havens like the dollar. Headline CPI rose from 2.1% to 2.5% year-over-year in January while producer prices increased by 6.9% versus the 6.6% forecast and the earlier 5.5% rise.
Moving forward, unease about Chinese regulations on bitcoin trading could continue to dampen bitcoin gains and keep a lid on volatility so short-term consolidation might carry on.
Charts from SimpleFX