Bitcoin Price Key Highlights
- Bitcoin price is back on its bullish track, moving inside an ascending channel visible on its 1-hour and 4-hour charts.
- Price just bounced off support and is setting its sights back on resistance.
- Technical indicators are giving mixed signals at the moment, but it looks like bitcoin price could be able to climb to the top of the channel.
Bitcoin price is making northbound momentum once more as investor confidence improved on recent industry developments.
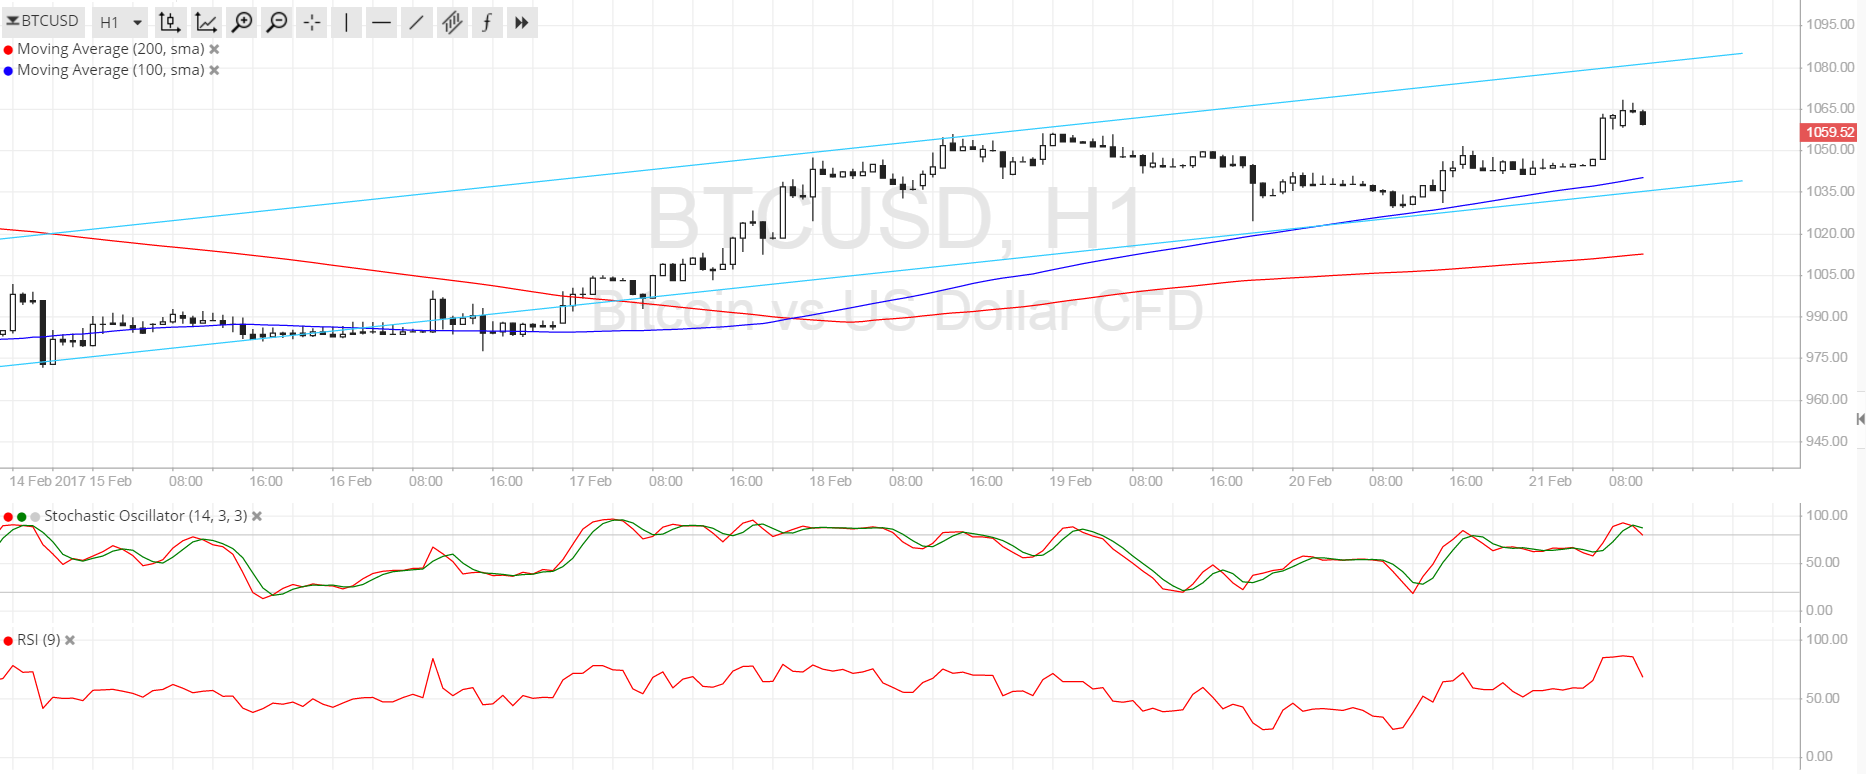
Technical Indicators Signals
The 100 SMA is above the longer-term 200 SMA on the 1-hour chart, signaling that the path of least resistance is to the upside. In other words, the uptrend is more likely to continue than to reverse. The gap between the moving averages is getting wider, reflecting stronger bullish pressure that might be enough to take bitcoin price to the ceiling at $1080 and beyond.
The 100 SMA lines up with the channel support at $1035, adding to its strength as a floor in the event of another correction. A larger pullback, on the other hand, can last until the 200 SMA dynamic inflection point at $1010, which could be the line in the sand for this ongoing rally.
Stochastic is indicating overbought conditions and is turning lower, suggesting that bearish pressure could return. RSI is also turning lower to indicate that buyers might need to take a break from here.

Market Events
Now that news on Chinese regulations on bitcoin exchanges appears to have taken the back seat, traders are turning their attention to the anticipated SEC approval of the Winklevoss bitcoin ETF COIN. If this pushes through, it could mean a strong boost to demand for the cryptocurrency and therefore a big push higher for bitcoin price.
On the other hand, another batch of setbacks could cast doubts on the viability of bitcoin as a traded instrument and mainstream payment vehicle, potentially dampening recent gains. US markets are poised for strong gains as big retailers print their earnings reports and Trump’s tax plan announcement could also have a huge impact on dollar action and market sentiment.
Charts from SimpleFX