Bitcoin Price Key Highlights
- Bitcoin price is still moving inside its uptrend channel visible on longer-term time frames.
- Price is currently testing the resistance near the $1200 mark as expected but is showing signs that buying pressure is fading.
- A reversal candlestick can be seen on the daily time frame but price has yet to close below the low at $1100 to confirm the potential selloff.
Bitcoin price has been able to keep up its climb but it might need to make a correction before heading any further north.
Technical Indicators Signals
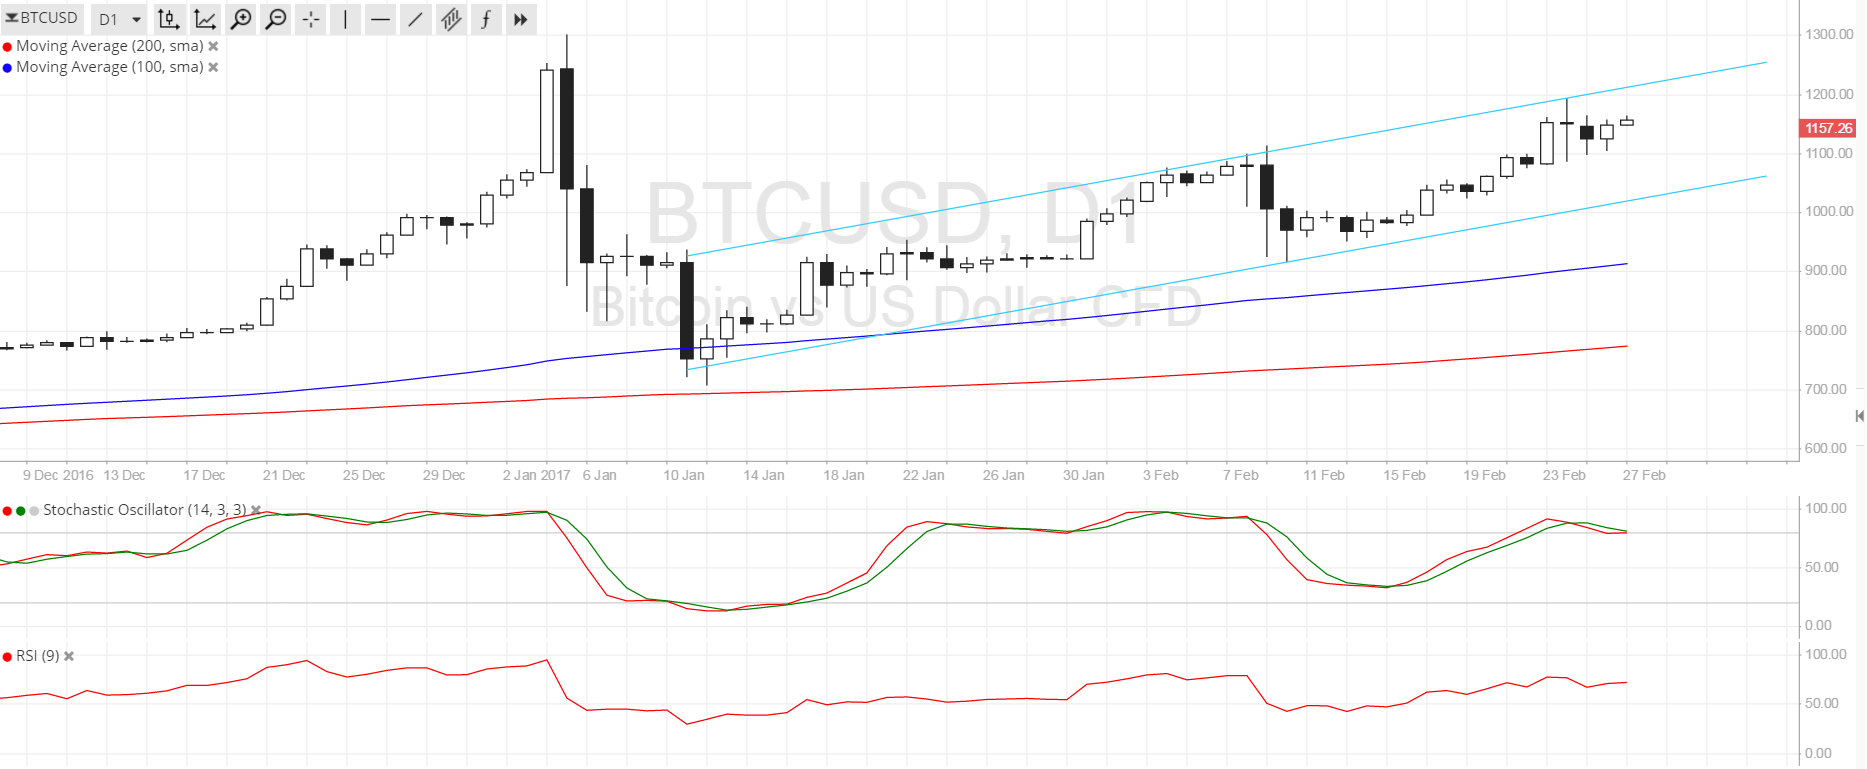
The 100 SMA is above the longer-term 200 SMA on this daily chart, which means that the long-term path of least resistance is to the upside. In addition, the gap between the moving averages is getting wider so bullish pressure is still picking up. In that case, there’s a possibility that bitcoin price could break past the channel resistance at $1200 and head straight for the $1300 mark or record highs.
Stochastic is already indicating overbought conditions and is turning lower, reflecting exhaustion among buyers and a potential return in bearish momentum. Similarly RSI is in the overbought territory but has yet to turn lower. If sellers take control, a pullback to the support at $1050 could take place. A break below this area could bring bitcoin price to the next area of interest at $1000 or the 100 SMA dynamic support.

Market Events
So far, there has been no major report on Chinese regulations for bitcoin trading even after authorities have been cracking down on money laundering activity on several exchanges. Still, investors seem to be on edge that another announcement might be made soon, which makes them reluctant to take bitcoin price any higher from here.
Aside from that, anticipation for Trump’s tax reform announcement is building up once more, possibly restoring dollar demand against bitcoin if the changes are likely to result to huge gains for US companies and equities. A disappointing announcement, on the other hand, could push bitcoin price higher against the dollar once more.
Charts from SimpleFX