Bitcoin Price Key Highlights
- Bitcoin price has previously consolidated inside a symmetrical triangle formation and is showing signs of breaking out.
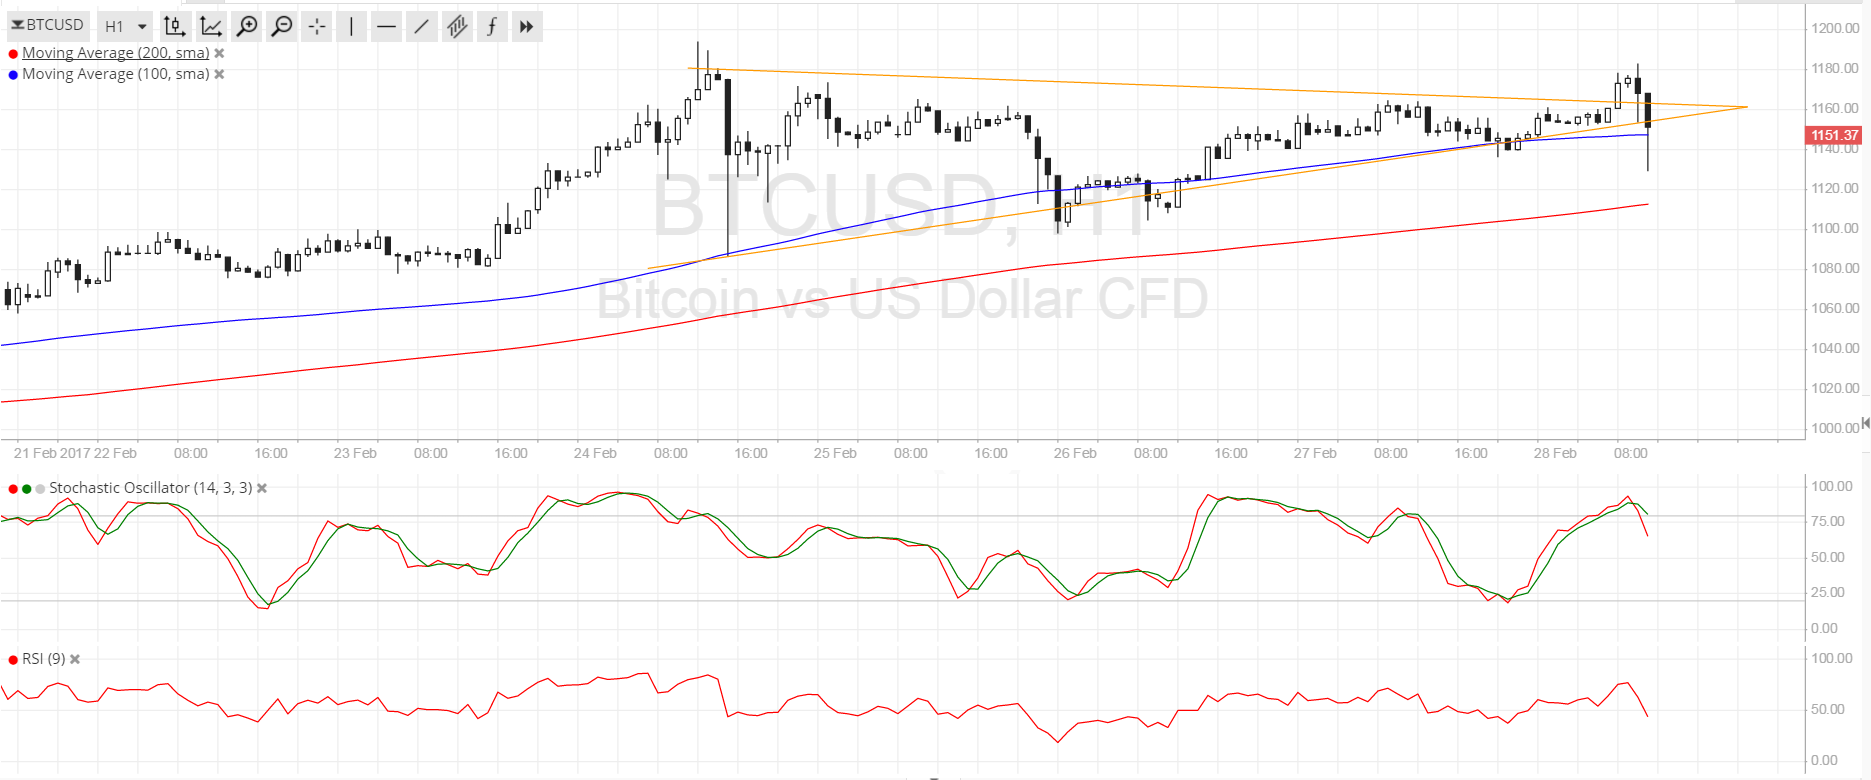
- Price looks ready to head back south as it is trying to move below the 100 SMA dynamic support.
- Oscillators are also hinting that bearish momentum is building up.
Bitcoin price looks poised to break down from its consolidation pattern as volatility is returning to the markets.
Technical Indicators Signals
The 100 SMA is above the longer-term 200 SMA on the 1-hour time frame, indicating that the path of least resistance is to the upside. The 100 SMA also lines up with the symmetrical triangle support but bitcoin price seems to be crashing below this area at the moment as signs of rally exhaustion are seen on the longer-term charts.
Stochastic is heading south from the overbought zone, which means that buyers are taking a break and allowing sellers to take control. Similarly, RSI is turning lower so bitcoin price could follow suit and test the next area of interest at the 200 SMA dynamic support. A move below the $1100 area could complete a double top formation on this time frame and signal further losses.

Market Events
The US dollar regained some ground against its peers, including bitcoin, even after US President Trump admitted that they are not ready to announce tax reform plans just yet. He did hint that they would unveil their spending plans for infrastructure and security in his upcoming speech in front of the joint sessions of Congress later today.
Data from the US economy has been mixed but policymakers continue to talk about the need to hike interest rates sooner rather than later, thereby driving up demand for the US currency versus bitcoin price as well. The big event for today is likely to be Trump’s testimony, although headlines from China could also move the markets as well. Note that industry PMI readings are up for release midweek and this tends to influence overall market sentiment.
Charts from SimpleFX