Bitcoin Price Key Highlights
- Bitcoin price has recently broken above the neckline of an inverse head and shoulders pattern visible on longer-term time frames.
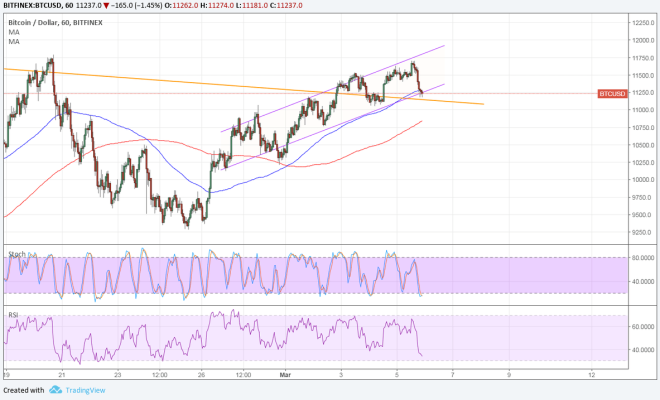
- Price is also moving inside an ascending channel on its 1-hour time frame and is testing support.
- This support lines up with the broken neckline, that might hold as a floor from here.
Bitcoin price is pulling back from its latest break above the $11,000 area of interest and might be due to resume its climb.
Technical Indicators Signals
The 100 SMA is above the longer-term 200 SMA on this time frame, so the path of least resistance is to the upside. This suggests that the uptrend is more likely to gain traction than to reverse. In addition, the 100 SMA lines up with the short-term channel bottom to add to its strength as a floor.
Zooming further back shows that the inverse head and shoulders spans $6,000 to around $11,000 so the resulting rally could be of the same height.
Stochastic is on its way down to indicate that the correction is still ongoing. Similarly, RSI is heading south so bitcoin price might follow suit. Then again, both oscillators are dipping into oversold territory to reflect exhaustion among sellers. Turning higher could signal that buyers are getting back in and ready to push bitcoin price to the next upside barrier at the channel resistance or $12,000.

Market Factors
Risk appetite returned to financial markets around halfway into the U.S. session when fears of a trade war seemed to fade. This propped commodities and stocks higher and bitcoin turned slightly lower in effect. Keep in mind that the market dynamic seems to be shifting recently, with bitcoin price taking advantage of risk-off flows once more.
The US dollar has also gained support from upbeat ISM non-manufacturing PMI, although it’s worth noting that the drop in the jobs component could signal a weaker NFP read on Friday. In that case, the US currency could slide back down on weaker tightening expectations, possibly favoring BTCUSD.