Bitcoin Price Key Highlights
- Bitcoin price seems to be running out of steam on its recent climb as it tests resistance around $11,500.
- Another drop to the nearby support at $9,500-10,000 could create a double top pattern.
- If price breaks below the neckline, bitcoin price could fall by the same height as the chart formation.
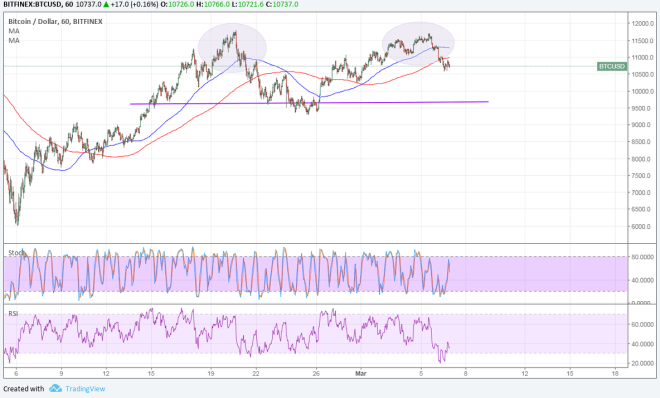
Bitcoin price could be due for a selloff as it formed a double top pattern on its 1-hour time frame.
Technical Indicators Signals
The 100 SMA is still above the longer-term 200 SMA to signal that the path of least resistance is to the upside. This suggests that the uptrend still has a chance of resuming.
Stochastic is also climbing to indicate that buyers have the upper hand and could allow bitcoin price to revisit the highs close to the $12,000 major psychological level. RSI is just pulling up from oversold conditions, also indicating a pickup in buying pressure.
A break below the neckline, on the other hand, could lead to a drop of around $2,000, which is the same height as the double top. A bounce off support could lead to a test of the highs or creation of new ones.

Market Factors
Fears of a trade war seemed to be abating as more U.S. government officials started reassuring the general public. However, the announcement of economic adviser Gary Cohn’s resignation brought these jitters back to financial markets, weighing on higher-yielding assets.
As it is, opposing factors seem to be in play for bitcoin price, which explains the hesitation to follow through on the inverse head and shoulders upside break. On the one hand, shifting risk sentiment has allowed the cryptocurrency to regain some of its safe-haven status, but traders are still understandably on edge.
One factor that could revive the stronger rally might be more updates on launching an ETF or its Index Fund. Of course it is pending regulatory approval, so any signs of being denied could lead to more bitcoin weakness.