Bitcoin Price Key Highlights
- Bitcoin price seemed to break out of its symmetrical triangle consolidation pattern yesterday but that seems to have been a fakeout.
- Price is back inside the triangle formation and is moving sideways so far.
- A breakout could provide traders a better idea of where bitcoin price might be headed in the longer-run.
Bitcoin price continues to tread sideways in tight consolidation inside a symmetrical triangle formation. A breakout could take place soon.
Technical Indicators Signals
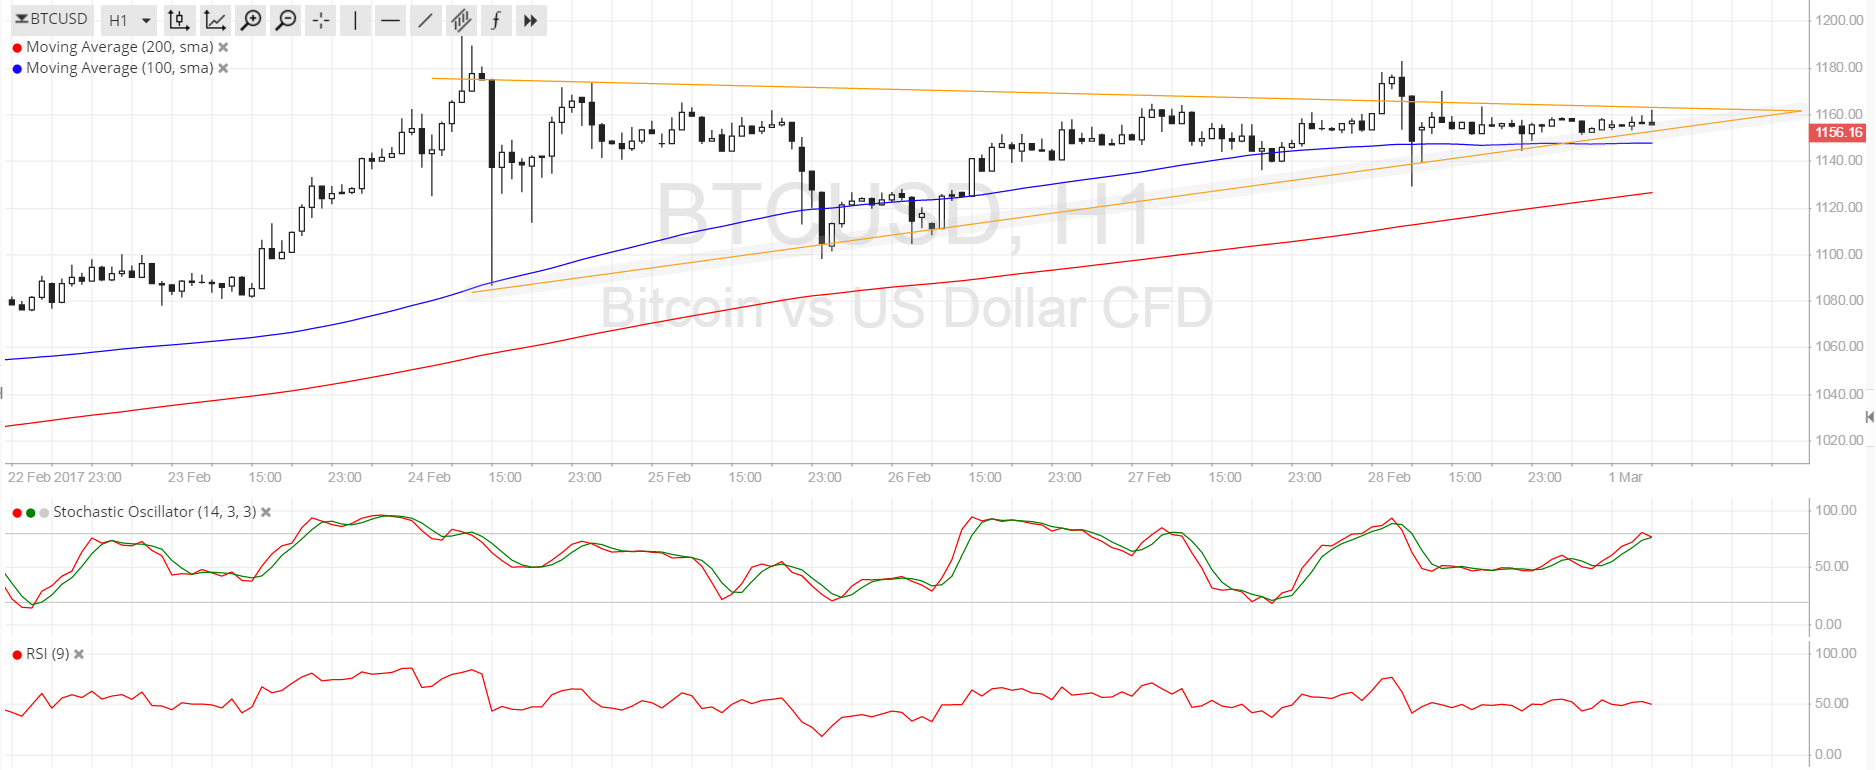
The 100 SMA is above the longer-term 200 SMA on this time frame so the path of least resistance is to the upside. In other words, an upside breakout might be more likely than a downward one. However, the gap between the moving averages is narrowing to suggest that selling pressure could take over once a downward crossover happens. For now, the 100 SMA lines up with the triangle support and is keeping losses in check.
Stochastic is heading up to show that buyers are in control of bitcoin price action for the time being. However, the oscillator appears to be making a turn lower to reflect a return in bearish momentum. A break below the triangle support could lead to a test of the 200 SMA dynamic inflection point then possibly a move back to the key $1000 mark.
A candle closing past the $1160 level could be enough to confirm an upside break while a candle closing below $1150 could signify a downward move. However, as evidenced in the earlier pickup in volatility, fakeouts are possible.

Market Events
Expectations are still running high for the approval of the bitcoin ETF this month, possibly sending bitcoin price to new all-time highs if it does push through. After all, having an ETF available would make the cryptocurrency more accessible to individuals and institutional investors, thereby boosting market liquidity.
For now, traders are also waiting to see how the markets would react to Trump’s infrastructure spending plans and its potential implications on tax reform. Economic data from the US has been mixed but policymakers continue to reinforce their biases of a March Fed hike, which would also be positive for the dollar.
Charts from SimpleFX