Bitcoin Price Key Highlights
- Bitcoin price has been unable to break out of its consolidation recently and continues to move sideways.
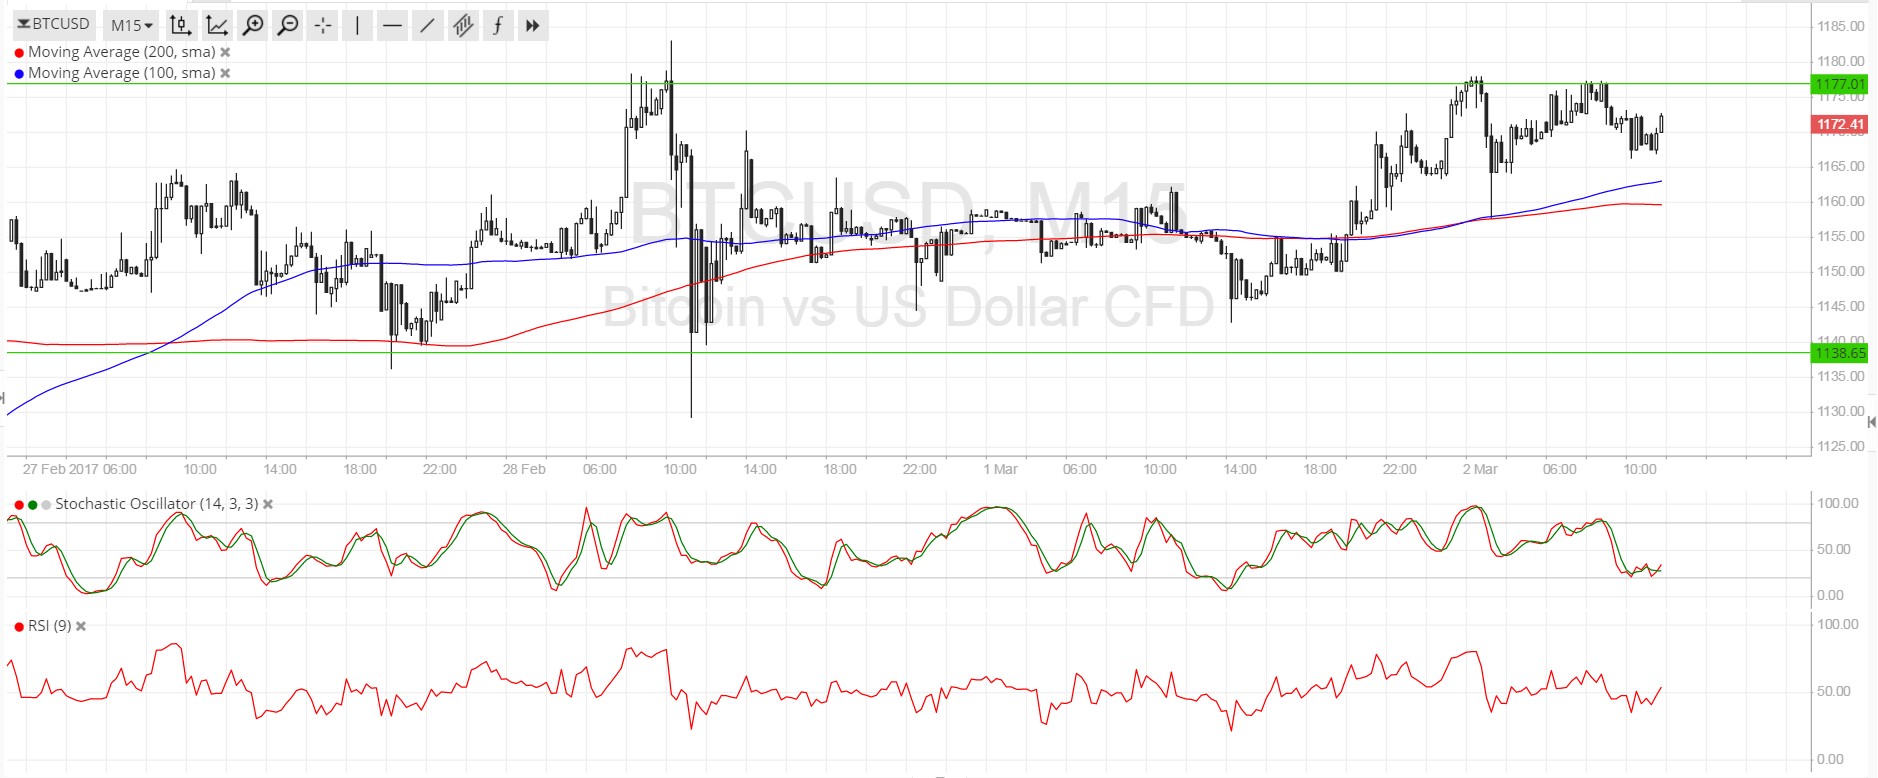
- Zooming in to the 15-minute chart reveals that price is pacing back and forth inside a range with support at $1140 and resistance around $1175.
- Price is currently testing the resistance and might be due for a drop back to the bottom.
Technical Indicators Signals
The 100 SMA is above the longer-term 200 SMA on this time frame so the path of least resistance is to the upside. In other words, a break higher could be possible rather than a breakdown. The gap between the moving averages is getting slightly wider to reflect stronger bullish pressure. Also, these dynamic inflection points are around the mid-range area of interest, which might be enough to keep near-term losses in check.
Stochastic is heading lower to show that sellers are in control of bitcoin price action now, possibly leading to a dip to the $1160 area or all the way down to the bottom of the range at $1140. RSI is also on the move down but is also cruising around the middle, confirming that range-bound conditions would likely stay in play.

Market Events
Dollar action wasn’t all that volatile after Trump’s speech to Congress, as some market watchers were disappointed about the lack of details on tax reform while others renewed their confidence in the U.S. economy from the infrastructure and security spending plans. To top it off, the U.S. President wasn’t his usual brash self and sounded more presidential, calming a bit of market anxiety.
As for bitcoin price, the focus is still mainly on the COIN ETF approval that is pending with the SEC. Analysts are pricing in low odds of the ETF making it all the way through at 10-25%, which means that there is a considerable short interest and a lot of potential for a big rally on a surprise approval. After all, this would make bitcoin more accessible to individuals and institutions, thereby ramping up liquidity even as other markets such as China are seeing low activity these days.
Charts from SimpleFX