Bitcoin Price Key Highlights
- Bitcoin price has slowly been climbing higher but there is still some hesitation among the bulls.
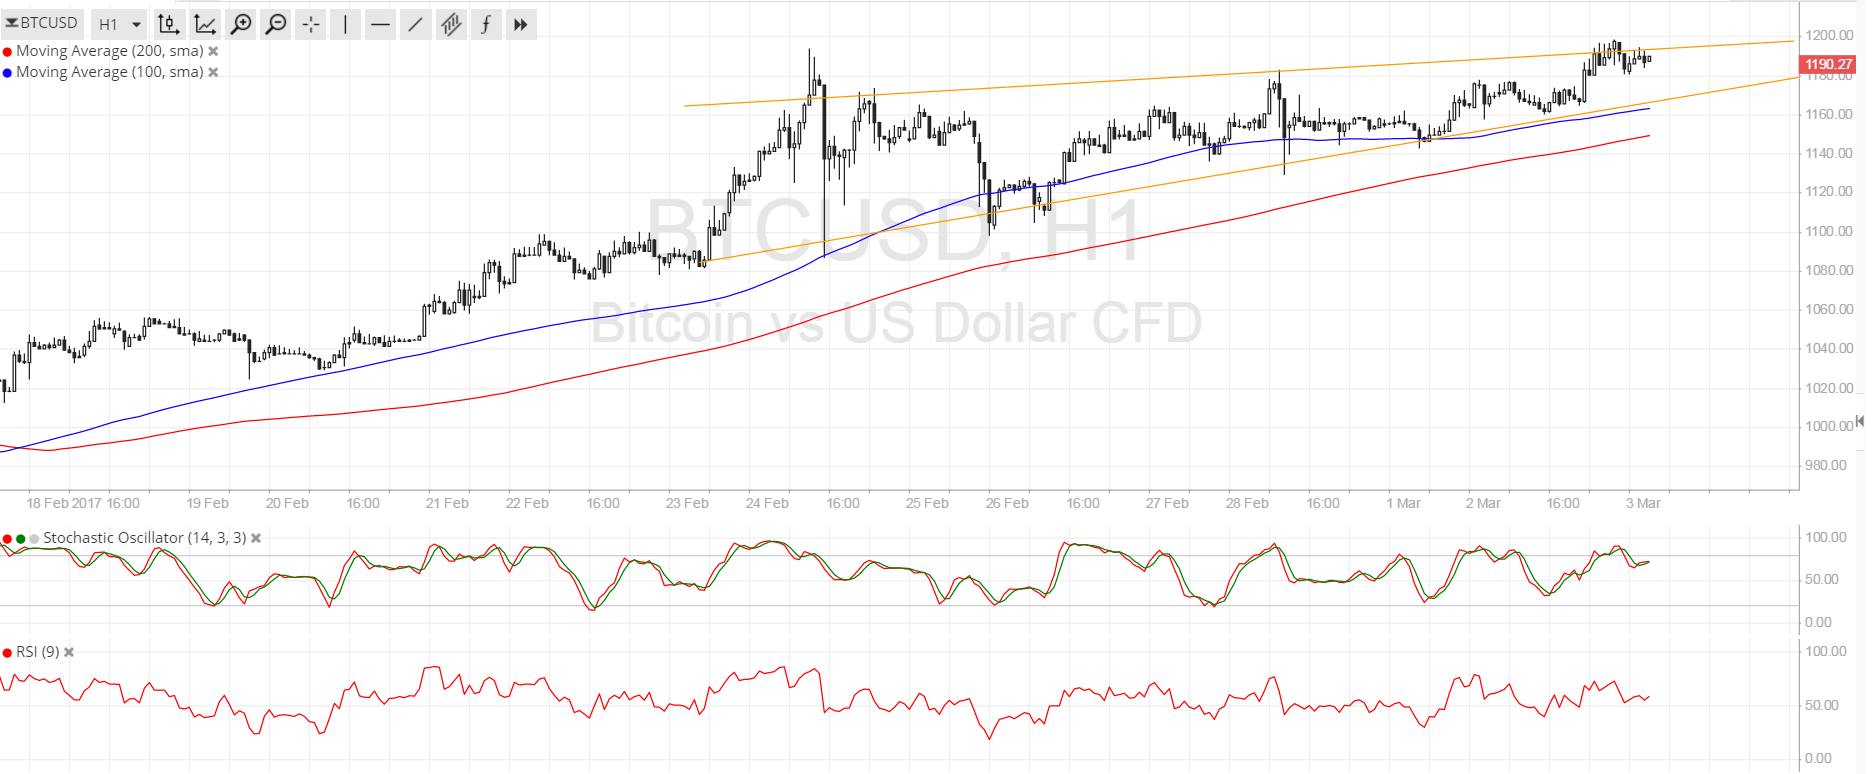
- Price is consolidating inside a rising wedge formation as trader wait for more market catalysts.
- Bitcoin price is now testing the wedge resistance and might be due for another move towards support.
Bitcoin price is edging higher but is also consolidating in a rising wedge formation as traders wait for stronger market clues.
Technical Indicators Signals
The 100 SMA is above the longer-term 200 SMA so the path of least resistance is to the upside. In addition, the 100 SMA lines up with the wedge support at $1160, adding to its strength as a floor. A move below this area could lead to a test of the 200 SMA dynamic inflection point at $1150. The gap between the moving averages is narrowing so bullish momentum could be weakening.
Stochastic seems to be turning lower as well, also suggesting that sellers may take control of price action from here. RSI also seems to be pointing down and ready to head south from the overbought area to reflect a pickup in bearish pressure.
If sellers are strong enough, they could push for a break of support and a drop of nearly $100 or the same height as the wedge formation. Similarly, a break past the resistance around $1200 could lead to around $100 in gains.

Market Events
There is still considerable buying interest in bitcoin but for now, traders seem to be holding tight and waiting for the outcome of the COIN bitcoin ETF application. Analysts are pricing in low odds of approval but if this pushes through, the cryptocurrency could enjoy a strong rally on a big boost to liquidity and investor interest. After all, having a bitcoin ETF would make it more accessible to individual and institutional investors in the United States, possibly making up for the slow volumes in China.
Speaking of China, traders still seem to be a bit on edge and ready to liquidate their positions in the event that new regulations are announced. It has been a good couple of weeks without any major news so bitcoin price has been able to recover slightly.
Charts from SimpleFX