Bitcoin Price Key Highlights
- Bitcoin price has been selling off in the past couple of days after breaking below a short-term rising trend line.
- The longer-term uptrend is still intact and bitcoin price is on its way to test a major support area.
- Technical indicators are suggesting that the uptrend could resume after this correction.
Bitcoin price is in the middle of a pullback from its longer-term climb but might be ready to resume the uptrend if support holds.
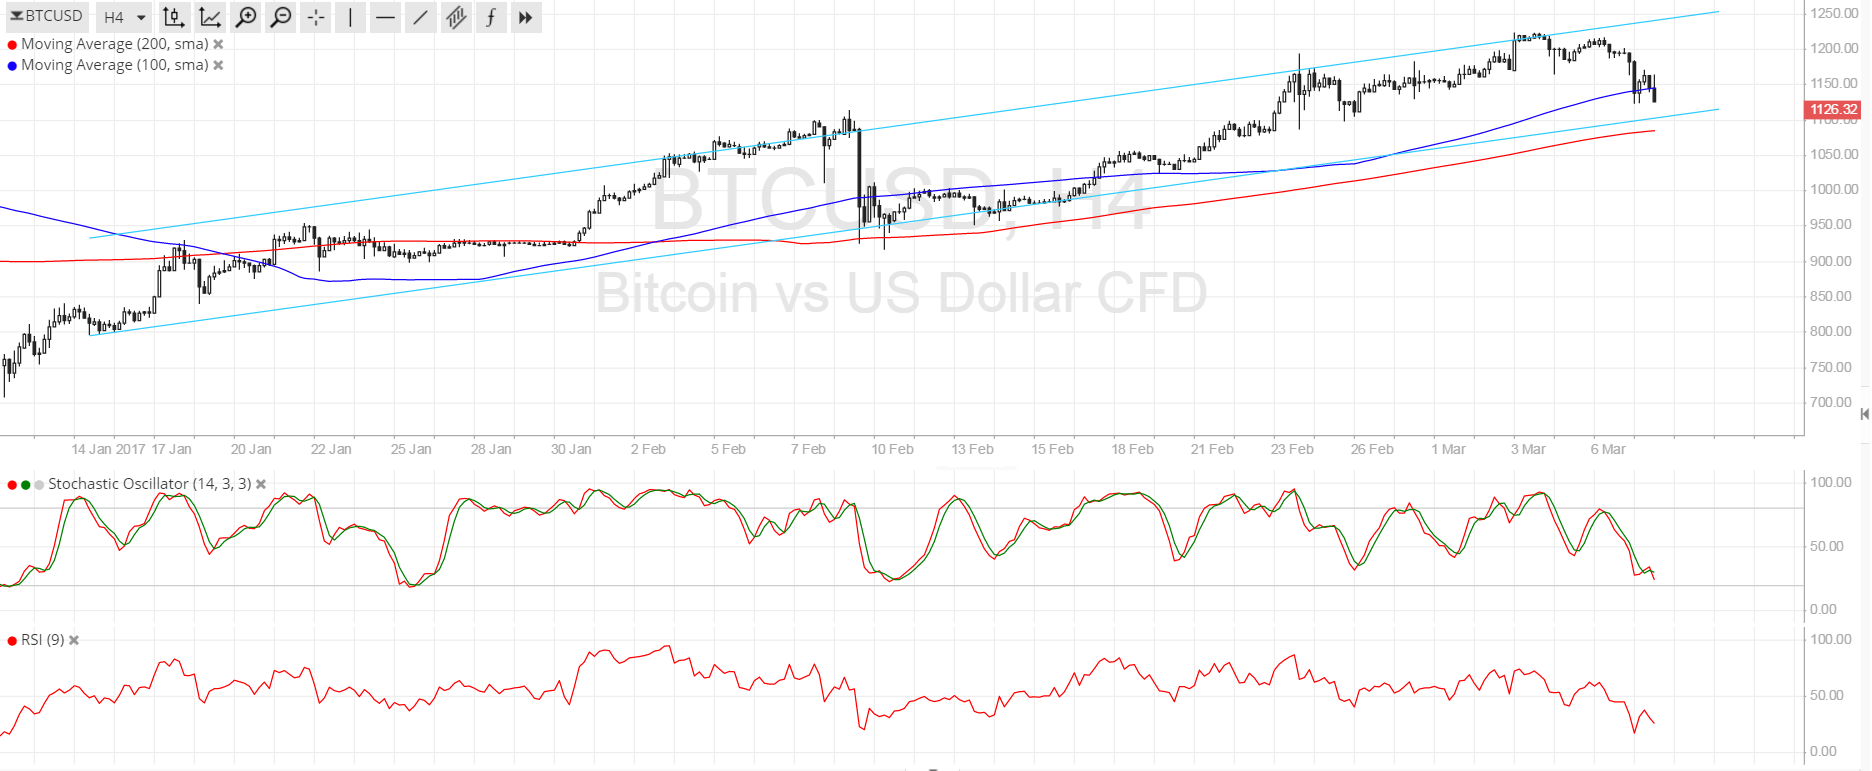
Technical Indicators Signals
The 100 SMA is above the longer-term 200 SMA so the path of least resistance is still to the upside. In addition, the 100 SMA is holding as dynamic support at the moment and might be enough to keep losses in check. A continued pullback, however, could last until the $1100 channel support closer to the 200 SMA dynamic inflection point.
If bitcoin price continues to slide below that level, a longer-term downtrend could be in the cards. Stochastic is on the move down to show that sellers are on top of their game at the moment while RSI is also heading south so price action could follow suit.
Once both oscillators hit the oversold areas and turn higher, buyers could return and push price back up to the channel resistance at $1250 and beyond. The gap between the moving averages is widening to suggest strengthening bullish momentum.

Market Events
The US dollar is strongly supported these days, thanks to expectations of a March Fed rate hike and overall risk aversion. This has weighed on higher-yielding assets like commodities and bitcoin. Still, an event risk for this behavior is the NFP report due on Friday since it could make or break tightening speculations.
Analysts are expecting to see a 188K rise in hiring, slower than the earlier 227K pickup. Another factor worth watching is the average earnings index as this would be considered a leading indicator of spending and inflation. The COIN ETF approval by the SEC is also another catalyst for bitcoin volatility this week.
Charts from SimpleFX