Bitcoin Price Key Highlights
- Bitcoin price has been stuck in a tight range lately, waiting for more directional clues from this week’s catalysts.
- Price is slowly grinding higher but is having difficulty breaking past the $415 area.
- If resistance continues to hold, bitcoin price could complete a head and shoulders reversal pattern, indicating the start of a selloff.
Bitcoin price appears ready to complete a reversal pattern on the 1-hour time frame, signaling a possible downtrend.
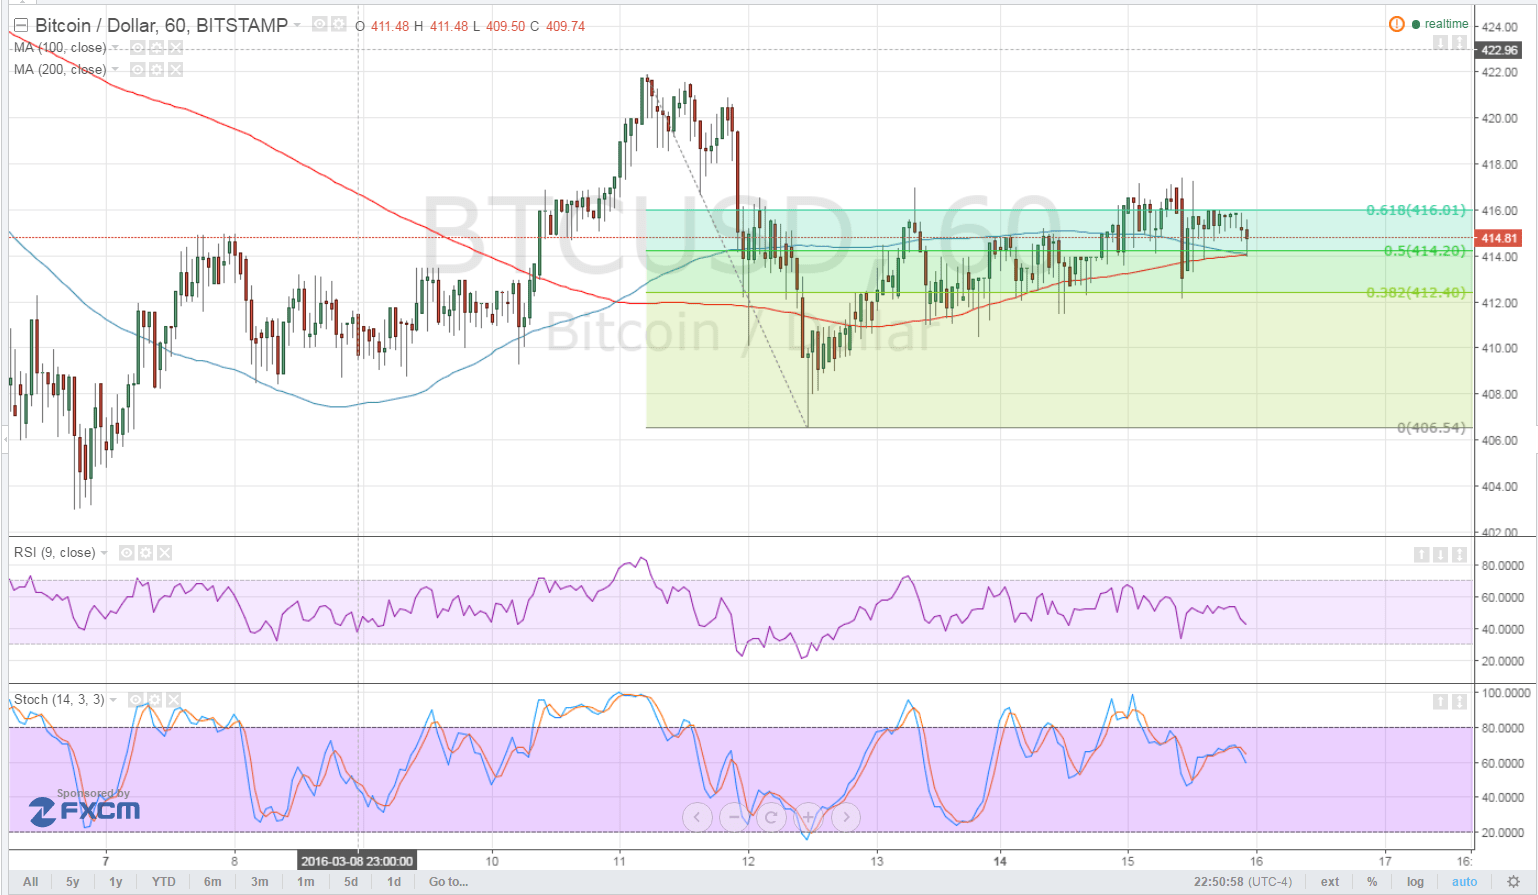
Technical Indicators Signals
The 100 SMA is attempting to cross below the longer-term 200 SMA to show that a downtrend is starting. In addition, RSI is heading south so price might follow suit and drop to the swing low near $405.
The Fibonacci retracement tool applied on the latest swing high and low shows that the 61.8% level lines up with the strong resistance and area of interest at $415. A break above this area could invalidate the pattern and lead to a move up to the highs at $425. Further rallies past that point could put bitcoin price on track towards $450 then $465.
Stochastic is also on the move down, which means that sellers are on top of their game now. If this carries on, a break below the swing low could take place and bring bitcoin price to the next support zones at $400 and $380.

Upcoming Catalysts
USD traders are waiting for today’s FOMC statement to decide longer-term dollar price trends, which explains why bitcoin price is stuck in tight consolidation at the moment. Data from the US economy namely PPI and retail sales printed mixed results yesterday so there’s a lot of uncertainty surrounding the FOMC announcement.
No actual interest rate changes are expected for now but there will be a press conference with Fed head Janet Yellen afterwards. Hawkish remarks could reinforce the view that rate hikes are still possible before the end of the year, driving up dollar demand against bitcoin price.
On the other hand, cautious comments could keep dollar gains in check, allowing bitcoin price to advance. Keep in mind that the promise of low borrowing costs could mean more optimism among businesses and consumers, which might lift higher-yielding assets like bitcoin and equities.
Also due today are the updated forecasts on growth and inflation, which should provide more clues on the Fed’s tightening timeline. Upgrades could support the idea of two or more rate hikes this year while downgrades could lead to either dollar selling or risk aversion. Policymakers will also share their latest dot plot of interest rate expectations.
Later on in the week, the Bank of England and Swiss National Bank are also set to make their monetary policy statements but no actual changes are expected from them as well. Commodity price trends could continue to affect overall market sentiment, and the recent declines owing to the lack of accord among oil producers to cap output levels is keeping a lid on gains.
Intraday support level – $405
Intraday resistance level – $415
Technical Indicators Settings:
- 100 SMA and 200 SMA
- RSI (14)
- Stochastic (8, 3, 3)
Charts from Bitstamp, courtesy of TradingView