Bitcoin Price Key Highlights
- Bitcoin price is still in range-bound conditions, as the FOMC announcement failed to spark strong volatility.
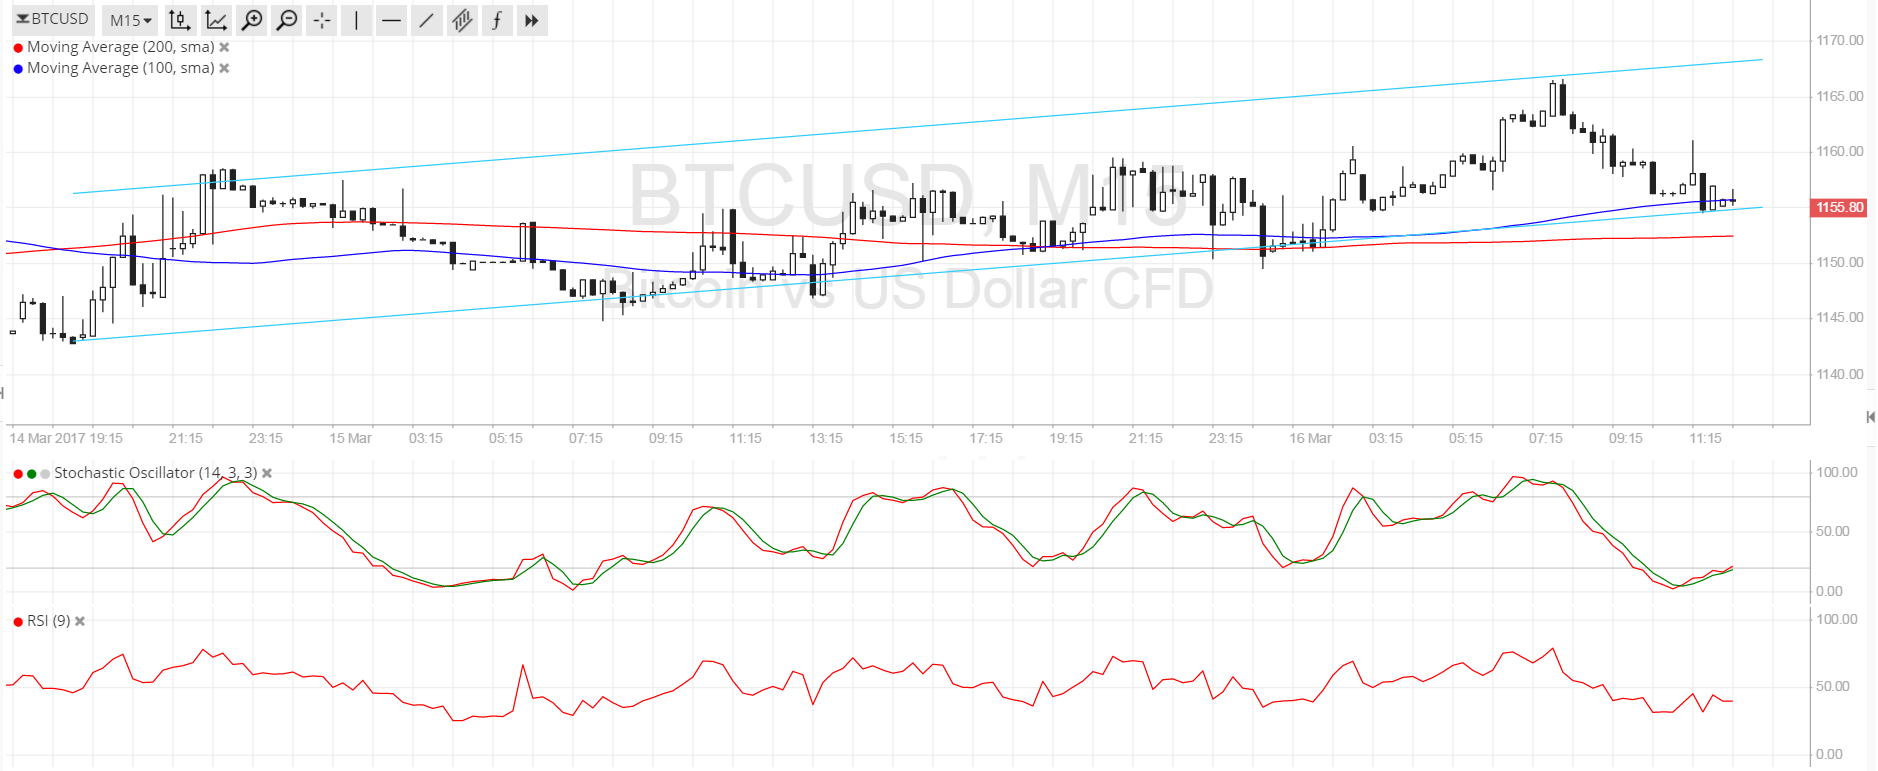
- Bulls are trying to retain control, keeping bitcoin price inside an ascending channel formation visible on short-term charts.
- Bitcoin is currently testing the rising channel support and technical indicators are suggesting a bounce back to resistance.
Bitcoin price is on a slow climb in a rising channel and may be due for a bounce off support back to nearby resistance.
Technical Indicators Signals
The 100 SMA is above the longer-term 200 SMA so the path of least resistance is to the upside. In addition, the gap between the moving averages is getting wider so bullish momentum is getting stronger. Also, the 100 SMA lines up with the channel support, acting to its strength as a floor.
Stochastic is on the move up, also confirming that buyers are in control of price action. A bit of bullish divergence can be seen since the oscillator made lower lows while price had higher lows since yesterday.
However, RSI is still on the move down so there may be some selling pressure left. A larger pullback could last until the 200 SMA dynamic support around $1153. If support holds, bitcoin price could climb back up to the resistance near $1170. On the other hand, a breakdown could send it to the next area of interest at $1145-1150.

Market Events
The FOMC statement was not as glaringly hawkish as many expected, even though the Fed did hike interest rates by 0.25% and signaled room for more tightening. The dot plot of forecasts suggested three rate hikes are still possible for the year, although it’s worth noting that one FOMC member dissented in favor of keeping rates on hold this time.
With that, the dollar sold off across the board after the announcement and press conference, with part of the move also attributed to profit-taking. Still, the currency regained ground against bitcoin at the end of the session and bulls could take this as a chance to buy the dollar at better prices.
In bitcoin industry news, PBOC officials and Chinese government officials continue to talk about cryptocurrency regulation but no actual measures have been announced yet.
Charts from SimpleFX