Bitcoin Price Key Highlights
- Bitcoin price recently broke below a short-term consolidation pattern and its rising trend line visible on the 4-hour chart.
- This signals a potential reversal from the earlier uptrend as bears are able to push bitcoin price below the strong support zone.
- Technical indicators are confirming a pickup in selling pressure at the moment.
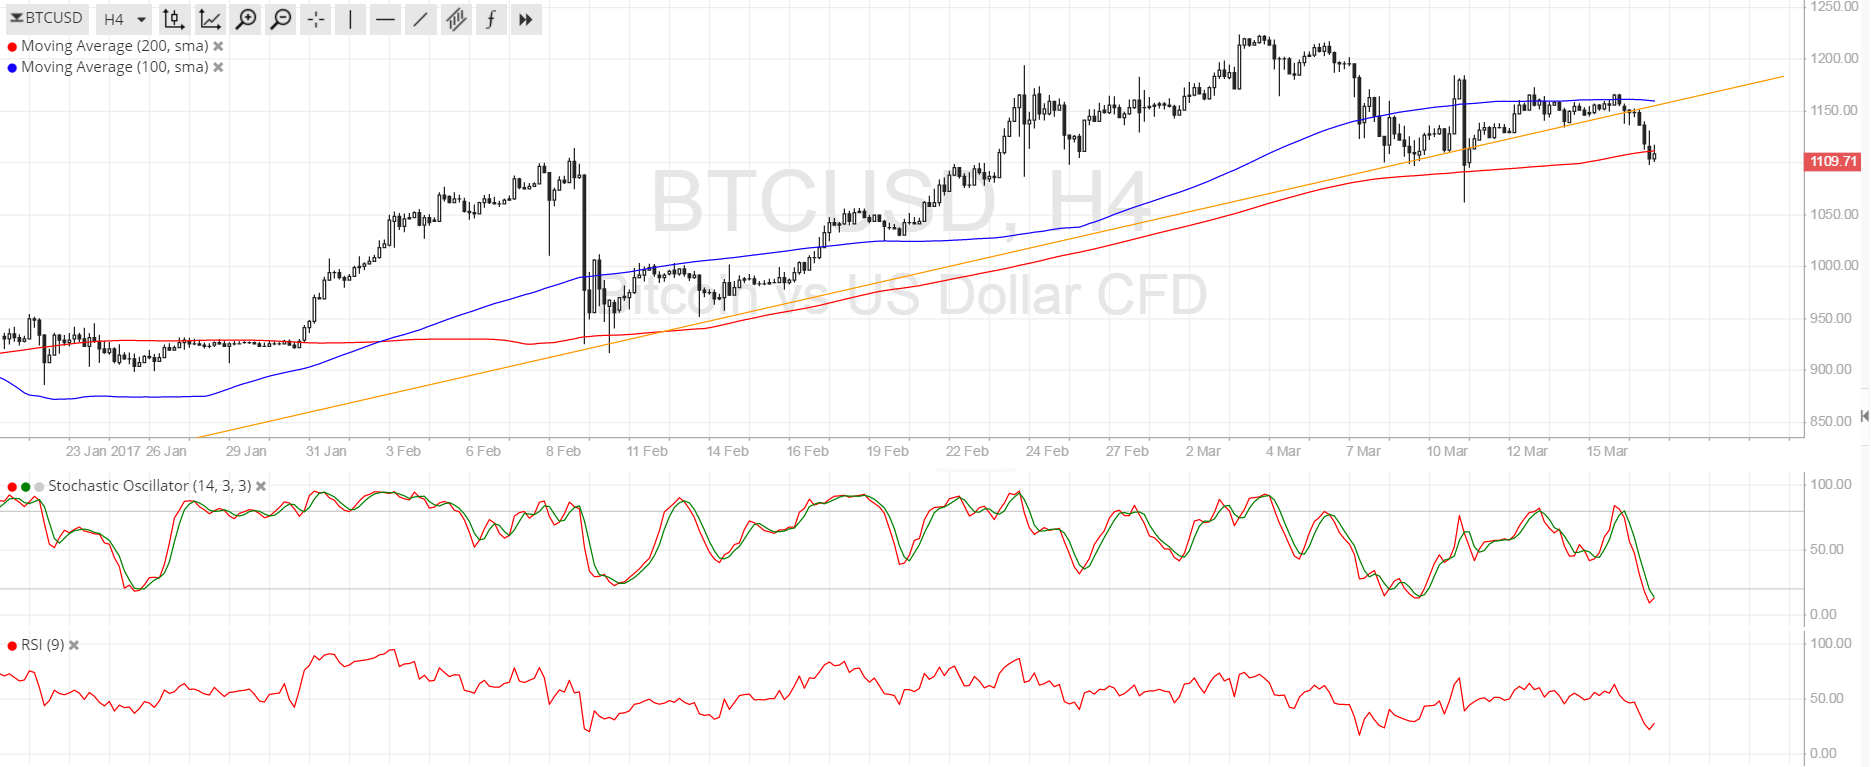
Bitcoin price broke below the rising trend line support, indicating that bears may be taking the upper hand from here.
Technical Indicators Signals
The 100 SMA is still above the longer-term 200 SMA so the path of least resistance might still be to the upside and this might prove to be a fakeout. Bitcoin price is testing the line in the sand at the 200 SMA dynamic support and a break below this level could confirm that a reversal is in the cards.
Stochastic is on the move down, also indicating that bearish pressure is in play. RSI is heading south as well so bitcoin price might follow suit. Once both indicators reach oversold levels, though, buyers could return and either spur a pullback or a continuation of the climb.
Price is also testing the resistance turned support level at the $1100 mark, which means that there may be a lot of buy orders located at this area. But if it gets breached, the next floor could be at $965.

Market Events
Dollar demand is slowly returning as traders are pricing in expectations of more Fed rate hikes in the coming months. Even though the FOMC statement wasn’t as hawkish as many would’ve wanted, it doesn’t change the fact that the US economy is on stable footing and that further tightening moves are likely.
Reports showing that Canada and India are issuing warnings on bitcoin Ponzi schemes are starting to remind traders of the incidence of fraud and manipulation that has plagued the cryptocurrency before. This follows the SEC denial of the bitcoin ETF last week, citing that the unregulated nature of bitcoin could expose investors to more risk.
Charts from SimpleFX