Bitcoin Price Key Highlights
- Bitcoin price is still pulling up from its dive and closing in on correction areas that could allow the selloff to resume.
- Price previously broke below an ascending trend line visible on the 4-hour time frame and support at the $1100 major psychological level.
- Technical indicators are also lining up to show a potential increase in selling pressure.
Bitcoin price has moved higher for the past couple of days but this could merely be a pullback from its recent sharp dive.
Technical Indicators Signals
The 100 SMA is nearing the 200 SMA for a potential downward crossover to indicate a pickup in bearish momentum. These moving averages are close to the area of interest at $1100, adding to its strength as a potential ceiling. A larger pullback could last until the broken trend line around $1150-1200.
If bears hop back in, bitcoin price could make another move towards the recent lows at $950 or perhaps even make a break lower to $900 or $850. On the other hand, a move back above the trend line could still allow bitcoin price to retest the highs near $1300.
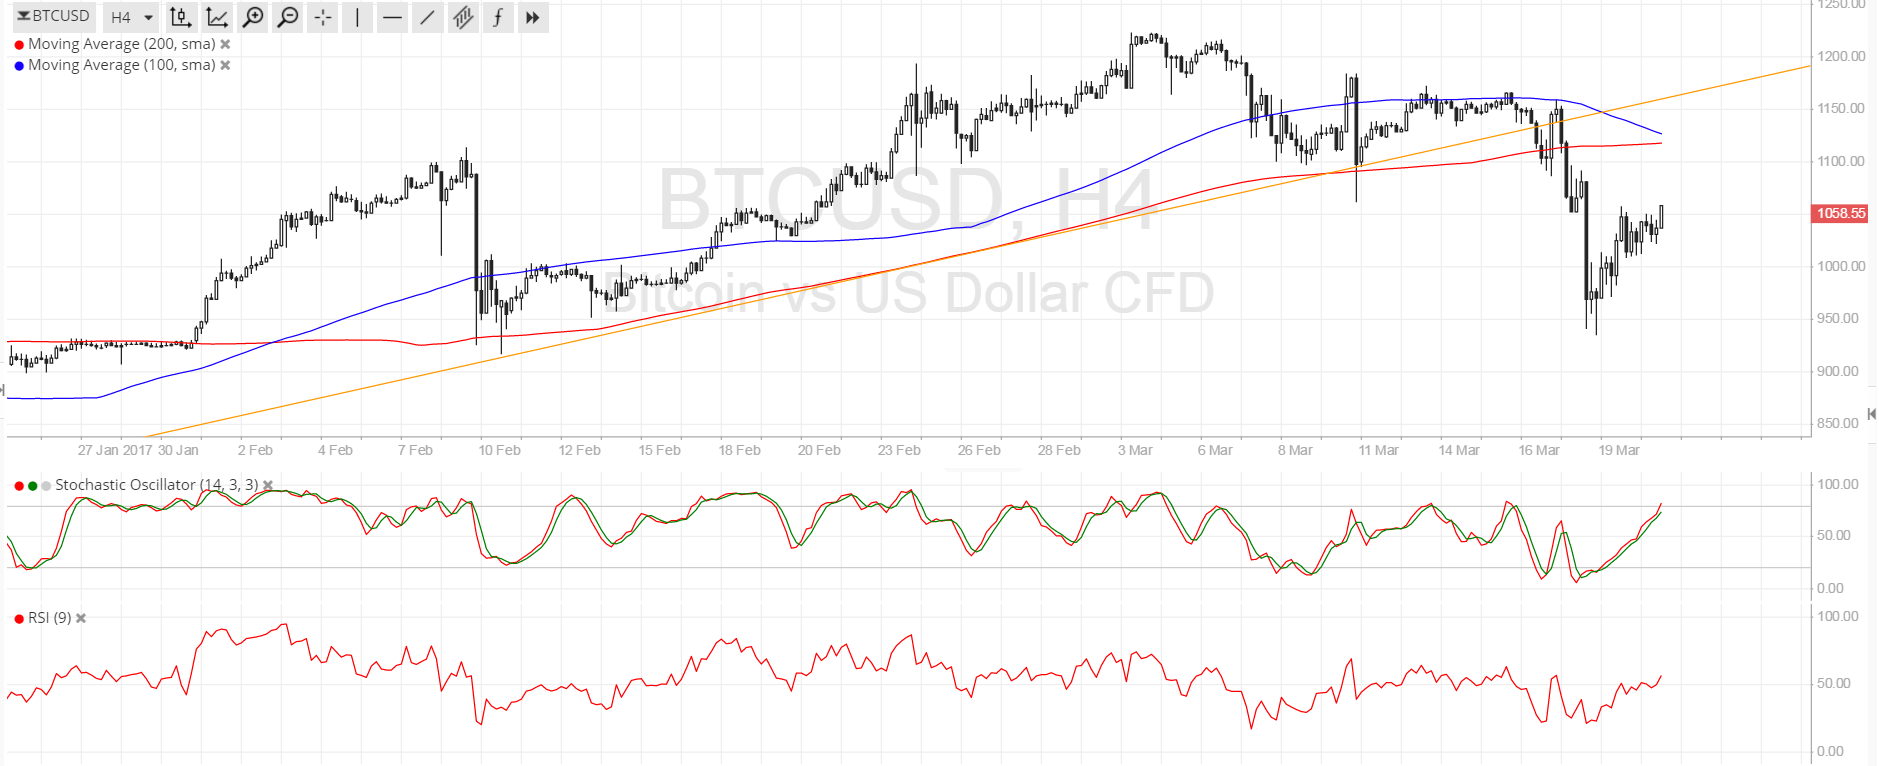

Stochastic is on the move up to show that buyers are in control of bitcoin price action at the moment. RSI is also heading north so price could follow suit. Once both oscillators reach the overbought zones and turn lower, selling pressure could return and allow the downtrend to gain more traction.
This could also lead to the completion of the right shoulder of a head and shoulders formation visible on the daily chart. The neckline would be around $950 and a break below this region could spur a selloff of around $300 or the same height as the reversal chart pattern.
The dollar seems to be regaining ground against its peers after some profit-taking during the March FOMC announcement. A couple of FOMC members acknowledged that more rate hikes are possible in the year, and this should shore up demand for US assets and the currency. Meanwhile, bitcoin traders are turning their attention back to potential regulation and the debates on a hard fork.
Charts from SimpleFX