Bitcoin Price Key Highlights
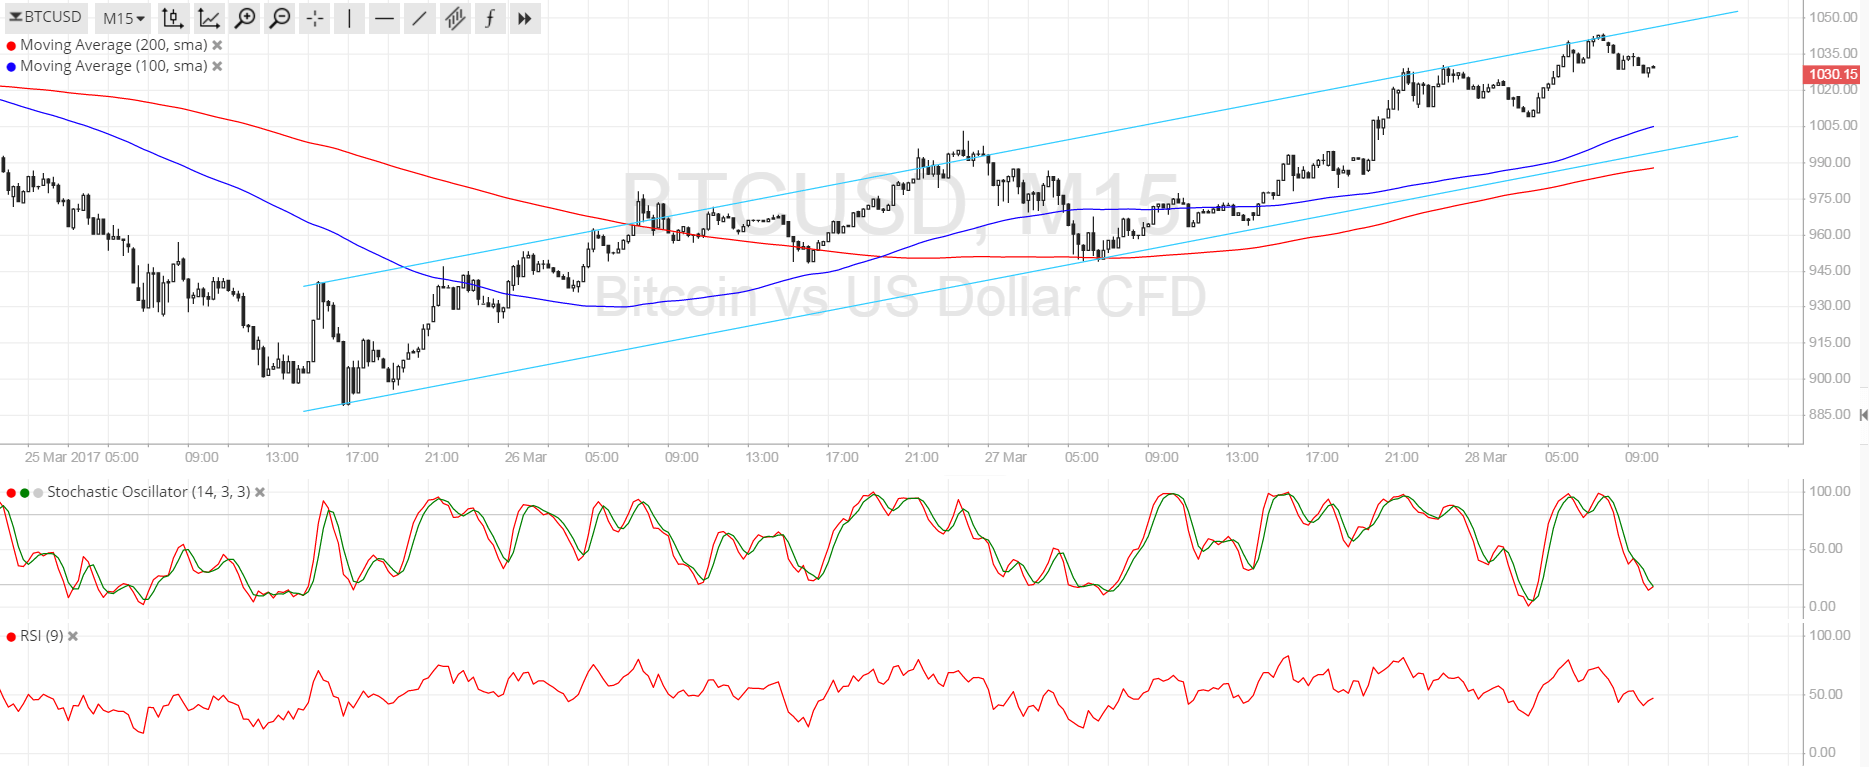
- Bitcoin price is slowly trending higher on the short-term time frames, moving inside an ascending channel on its 15-minute chart.
- Price is about to test a falling channel resistance on its longer-term chart, and this coincides with the 15-minute channel top.
- Technical indicators are showing that the uptrend could continue but that a pullback is due.
Bitcoin price could retreat to the channel support on the short-term time frames but still maintain its climb.
Technical Indicators Signals
The 100 SMA is above the longer-term 200 SMA, which means that the path of least resistance is to the upside. In addition, the short-term 100 SMA is just above the channel support at the $1000 major psychological level, adding to its strength as a floor. A larger correction could last until the 200 SMA at $990.
Stochastic is heading south so bitcoin price might follow suit. This suggests that the current resistance around $1050 is likely to keep gains in check. RSI is also turning lower to indicate that sellers are in control of price action. Stochastic is already approaching the oversold area to indicate exhaustion among bears, possibly drawing buyers back to the game once the oscillator turns back up.
If selling pressure is strong enough, bitcoin price could break below the channel support and head to the next area of interest at $950 or the previous week low closer to $900. On the other hand, a strong return in buying pressure could spur a break past the resistance to start a steeper rally.

Market Events
Dollar weakness has allowed bitcoin price to recover somewhat after the US Congress failed to pass a bill on healthcare reform, something that is necessary to fund their other fiscal policy changes. However, bitcoin price is also dealing with downside pressures of its own, particularly when it comes to the network hard fork.
Exchanges and payment platforms continue to warn their clients of the potential risks from this change, with Circle warning that bitcoin services could be disrupted for an extended period of time if incompatibilities arise.
Charts from SimpleFX