Bitcoin Price Key Highlights
- Bitcoin price bounced off the resistance on the descending channel pointed out in an earlier article.
- Bears look ready to get back in the game and push bitcoin price back to the channel support.
- Technical indicators are all lining up for another likely selloff.
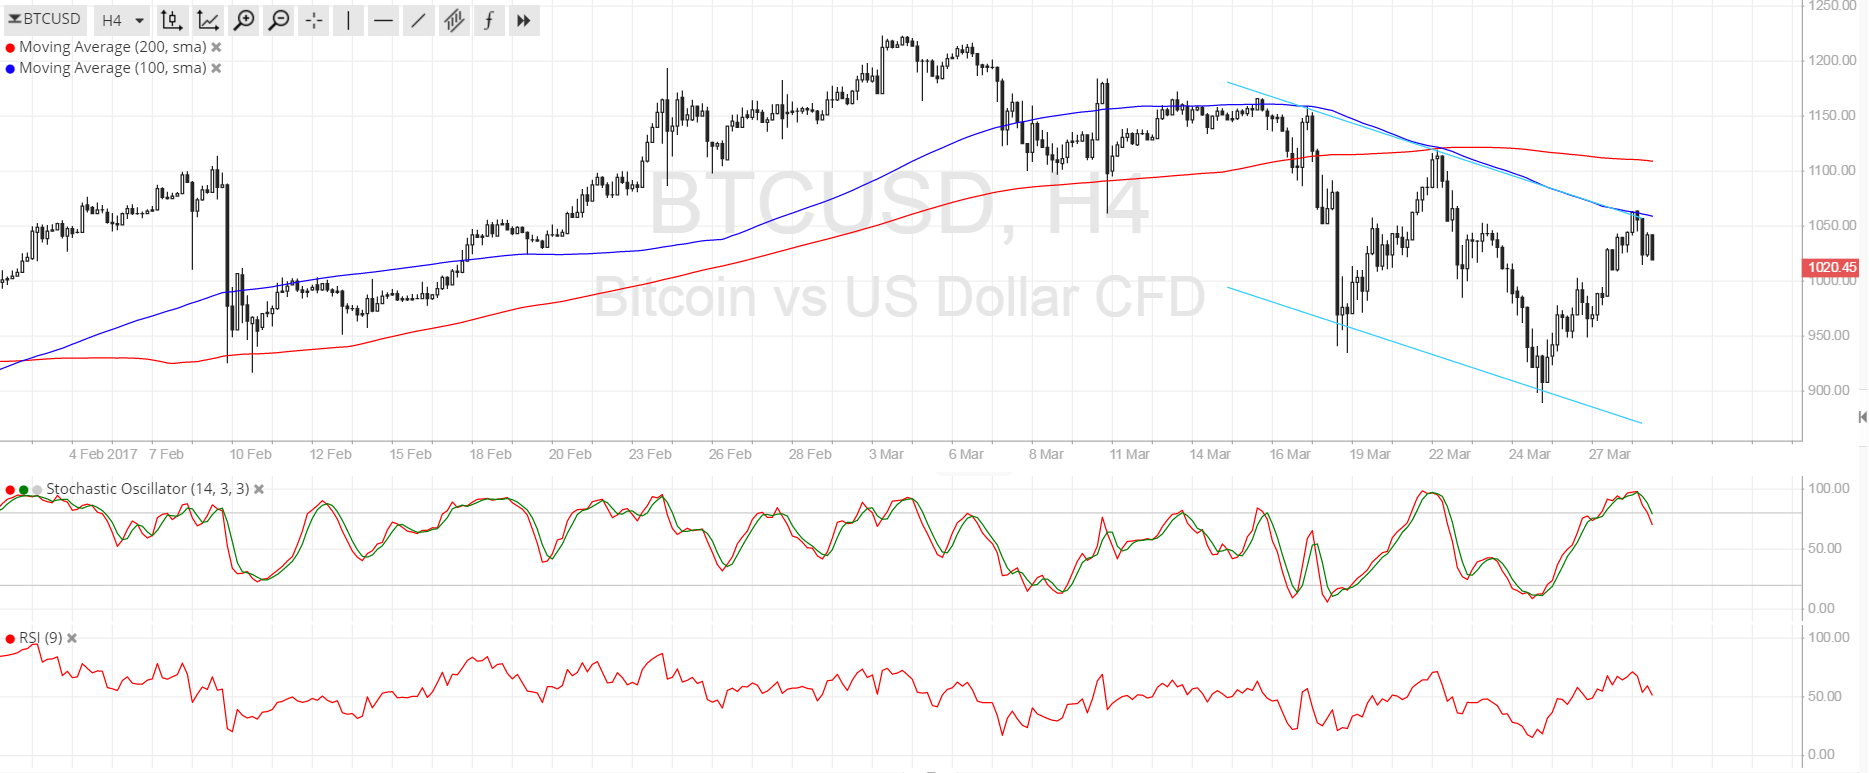
Bitcoin price was rejected at the channel resistance around $1050 and is now setting its sights back on support once more.
Technical Indicators Signals
The 100 SMA is below the longer-term 200 SMA so the path of least resistance is to the downside. Also, the short-term moving average coincides neatly with the descending channel resistance, adding to its strength as a ceiling. The gap between the moving averages is widening to reflect rising bearish pressure.
Stochastic is turning down from the overbought zone to show that sellers are regaining control of price action while buyers take a break. RSI is also pointing down so bitcoin price might follow suit. In this case, price could head to the previous lows at $900 then onto the channel support near $850.
A bit of a head and shoulders pattern can also be seen when zooming out to the 4-hour or daily chart, with price recently breaking below the neckline then pulling back up for a retest of the broken support zone.

Market Events
The US dollar seems to be getting back on its feet these days, as Republicans have maintained that they will continue to pursue healthcare reform. To top it off, economic data has been strong as usual, with the CB consumer confidence index posting a sharp gain to reach its highest level since December 2000 and the goods trade deficit showing a pickup in shipments.
As for bitcoin, US regulators rejected another ETF proposal, following their denial for the Winklevoss twins’ COIN ETF earlier in the month. SolidX Bitcoin Trust failed to secure a license to be listed on the NYSE and traders are pricing in lower odds for the next application from Grayscale Partners.
Charts from SimpleFX