Bitcoin Price Key Highlights
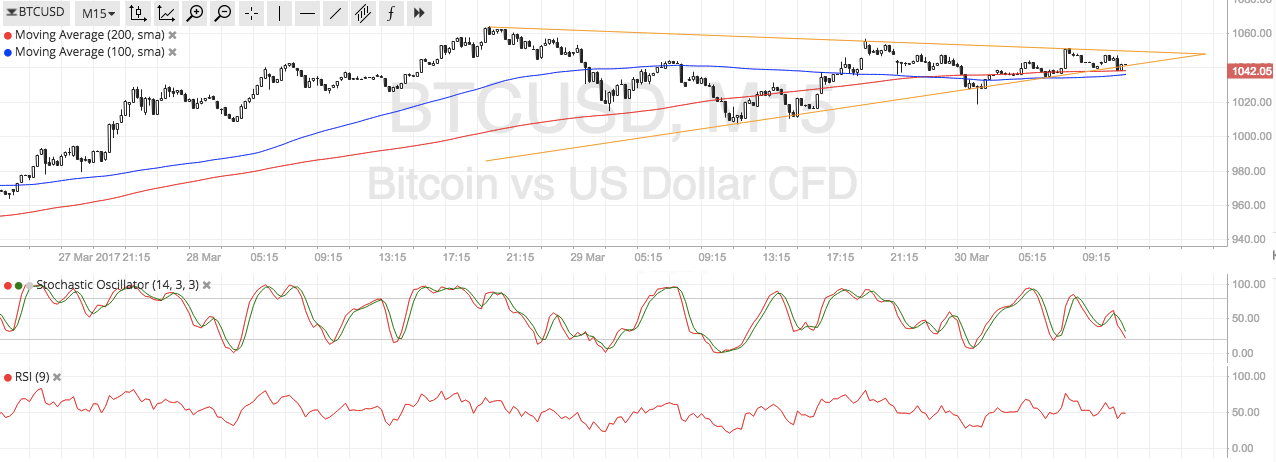
- Bitcoin price has formed lower highs and higher lows on its short-term time frame, creating a symmetrical triangle consolidation pattern.
- Price is nearing the peak of its formation so a breakout could be due soon.
- An upside breakout could signal that bitcoin price is in for more gains while a downside break could leave room for more losses.
Bitcoin price is consolidating in a short-term triangle pattern as traders are holding out for a fresh batch of market catalysts in the upcoming quarter.
Technical Indicators Signals
The 100 SMA just crossed below the longer-term 200 SMA to suggest that the path of least resistance is to the downside. In other words, a break lower could be more likely to happen than an upside break. However, it’s too early to call this a conclusive downward crossover as moving averages still appear to be oscillating.
RSI is on the move down to show that bitcoin price is under some selling pressure. However, the oscillator is around the middle of the range so some consolidation could be in the cards. Stochastic is also heading south to indicate that bearish momentum is in play. Once both oscillators reach the oversold level to indicate seller exhaustion, buyers could get back in the game.

Next areas of interest to the downside are located at the $1000 major psychological level then at the $950 former resistance and then at $900. To the upside, resistance is located at $1050 then at $1100, which could serve as near-term ceilings on a pop higher.
Market Events
Opposing forces are working on bitcoin price at the moment as the cryptocurrency is being dragged down by the denial of bitcoin ETF by the SEC and the looming hard fork. There doesn’t seem to be any kind of consensus forming anytime soon so the network could be forced to choose between two existing versions of the software.
Meanwhile, the US dollar is waiting for more clues in terms of direction as economic data has been upbeat, but investors are waiting to see how the Trump administration is keen on pushing its reform agenda. Signs that the White House can enact its tax policy changes sooner rather than later could spur more gains for the dollar.
Charts from SimpleFX