Bitcoin Price Key Highlights
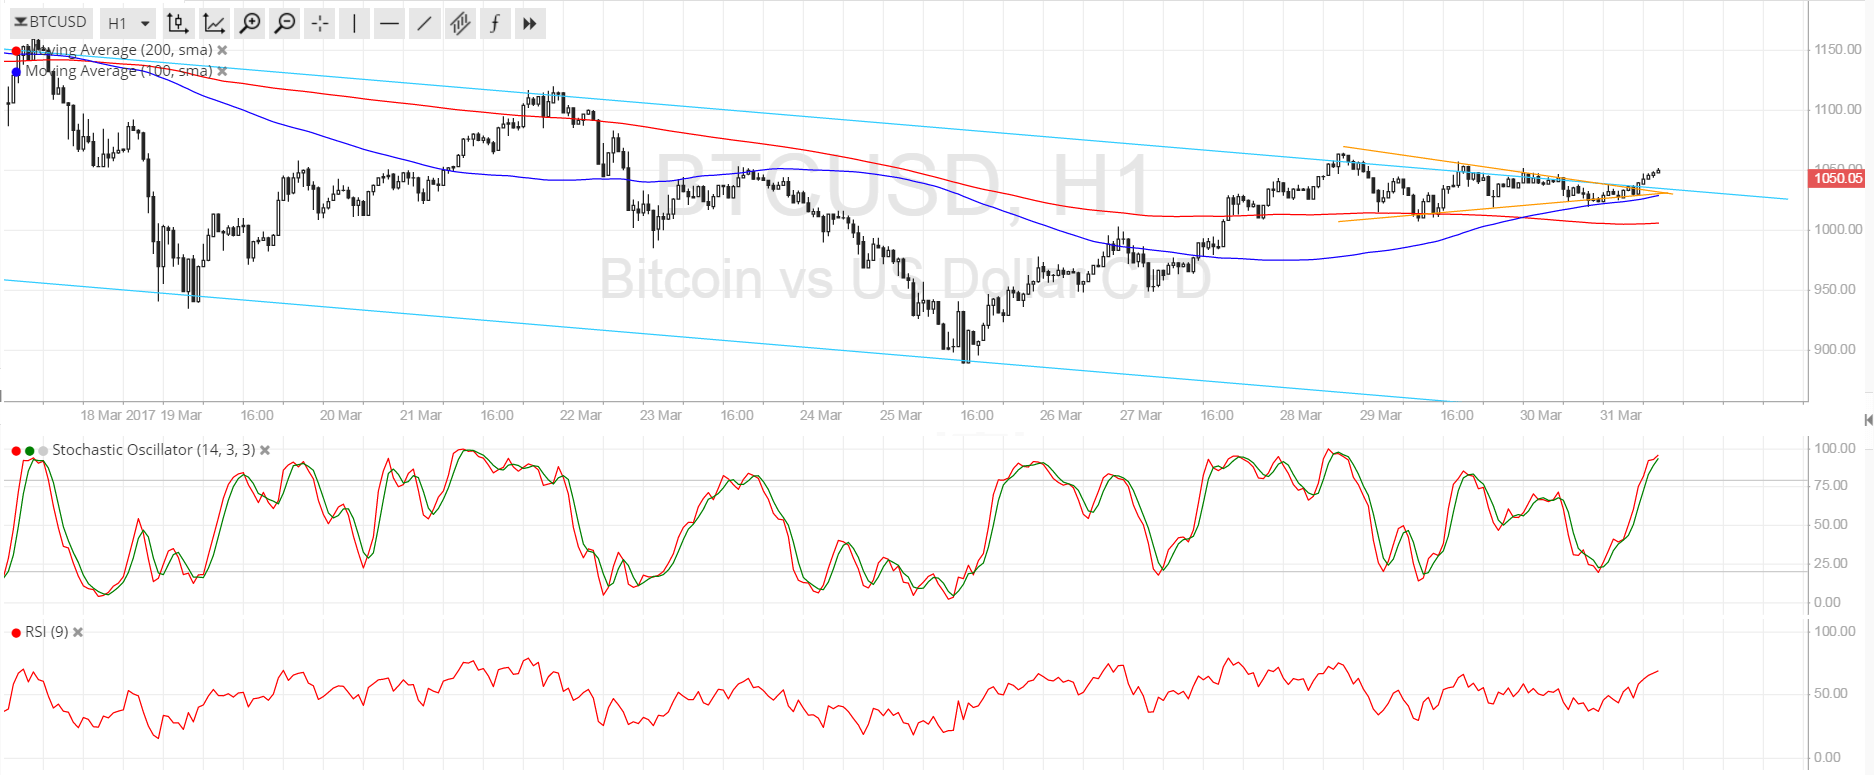
- Bitcoin price is breaking above the descending channel resistance and a short-term triangle consolidation pattern.
- This signals that bulls are getting stronger and could spur a reversal from the downtrend.
- Technical indicators are also showing that buying momentum could carry on and take bitcoin price much higher from here.
Bitcoin price is making an upside breakout from a trend channel and a bullish flag pattern, signaling that buyers are getting back in the game.
Technical Indicators Signals
The 100 SMA just crossed above the longer-term 200 SMA so the path of least resistance is to the upside. In addition, the 100 SMA dynamic support lines up with the short-term triangle bottom, adding to its strength as a floor. A pullback could still find support at this level, which also coincides with the broken channel resistance.
Stochastic is on the move up so bitcoin price could follow suit. RSI is also turning higher after spending some time moving sideways, also indicating that buyers are regaining the upper hand. This could be enough to take bitcoin price at least to the triangle highs at $1060 and beyond.
However, if this proves to be a fakeout and traders quickly book profits at the end of this week and quarter, bitcoin price could fall back inside the longer-term channel and resume its selloff back to support at $850 or halfway there until $950.

Market Events
Profit-taking is expected by the end of this week as it also closes out the first quarter of 2017. As such, most investors are likely to book their winnings and close out their positions to crunch the numbers.
Although the dollar gained across the board versus its forex counterparts yesterday, it seems that risk appetite surged along with it so bitcoin price took advantage. The cryptocurrency is also drawing some support from uncertainties surrounding US fiscal policy and the upcoming Brexit negotiations. Reports that several exchanges are rejecting Bitcoin Unlimited, which is the newer version of the software, is renewing confidence that existing bitcoin will not lose its value.
Charts from SimpleFX