Bitcoin Price Key Highlights
- Bitcoin price gained more bullish momentum after breaking past a near-term resistance and a continuation pattern as predicted in the earlier article.
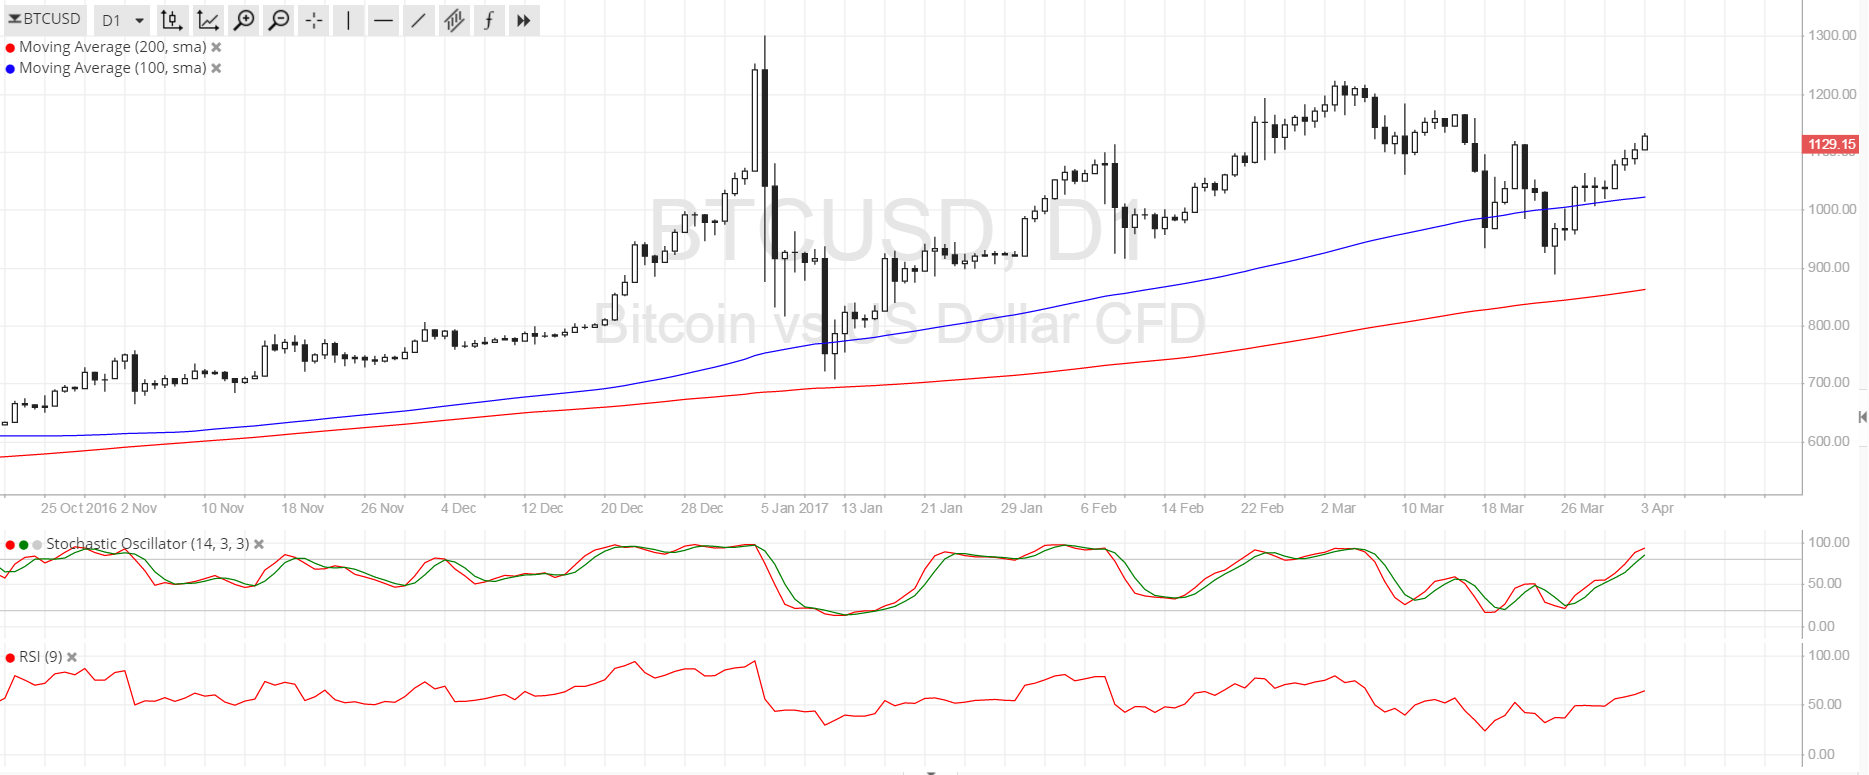
- With the longer-term uptrend still intact, bitcoin seems to be setting its sights back on the next ceiling at $1200.
- Technical indicators are showing that the bullish run could carry on.
Bitcoin price gained further upside traction after confirming the pickup in bullish momentum at the end of the previous week.
Technical Indicators Signals
The 100 SMA is above the longer-term 200 SMA on the daily chart so the path of least resistance is to the upside. Also, the gap between the moving averages is widening to reflect stronger bullish pressure. The 100 SMA also recently held as dynamic support and might continue to keep losses in check.
Stochastic is heading north so bitcoin price might follow suit. RSI is also on the move up to show that buyers are in control of price action. However, the former is dipping into the overbought zone already, warning that a slowdown in bullish momentum could be seen and that sellers could take over soon.
If profit-taking happens at the $1200 area, bitcoin price could retreat to the nearby support at $950-1000. A break below this area could signal a sharper drop to $800. On the other hand, a move past $1200 could take price back up to its all-time highs and beyond.

Market Events
Bitcoin investors seem to be enjoying a revival of confidence as more and more exchanges and platforms are rejecting Bitcoin Unlimited, which is a new version of the software that could render old bitcoin invalid. This move confirms that bitcoin holdings are not likely to lose their value in the near future, attracting more investment activity once more.
Reports are showing that key bitcoin experts have reached a grand consensus on the scalability issue, removing risks involved in the hard fork. At the same time, the presence of risk aversion in other financial markets owing to Brexit and Trump administration uncertainties is keeping bitcoin supported.
Charts from SimpleFX