Bitcoin Price Key Highlights
- Bitcoin price kept climbing as uncertainties related to the hard fork are subsiding.
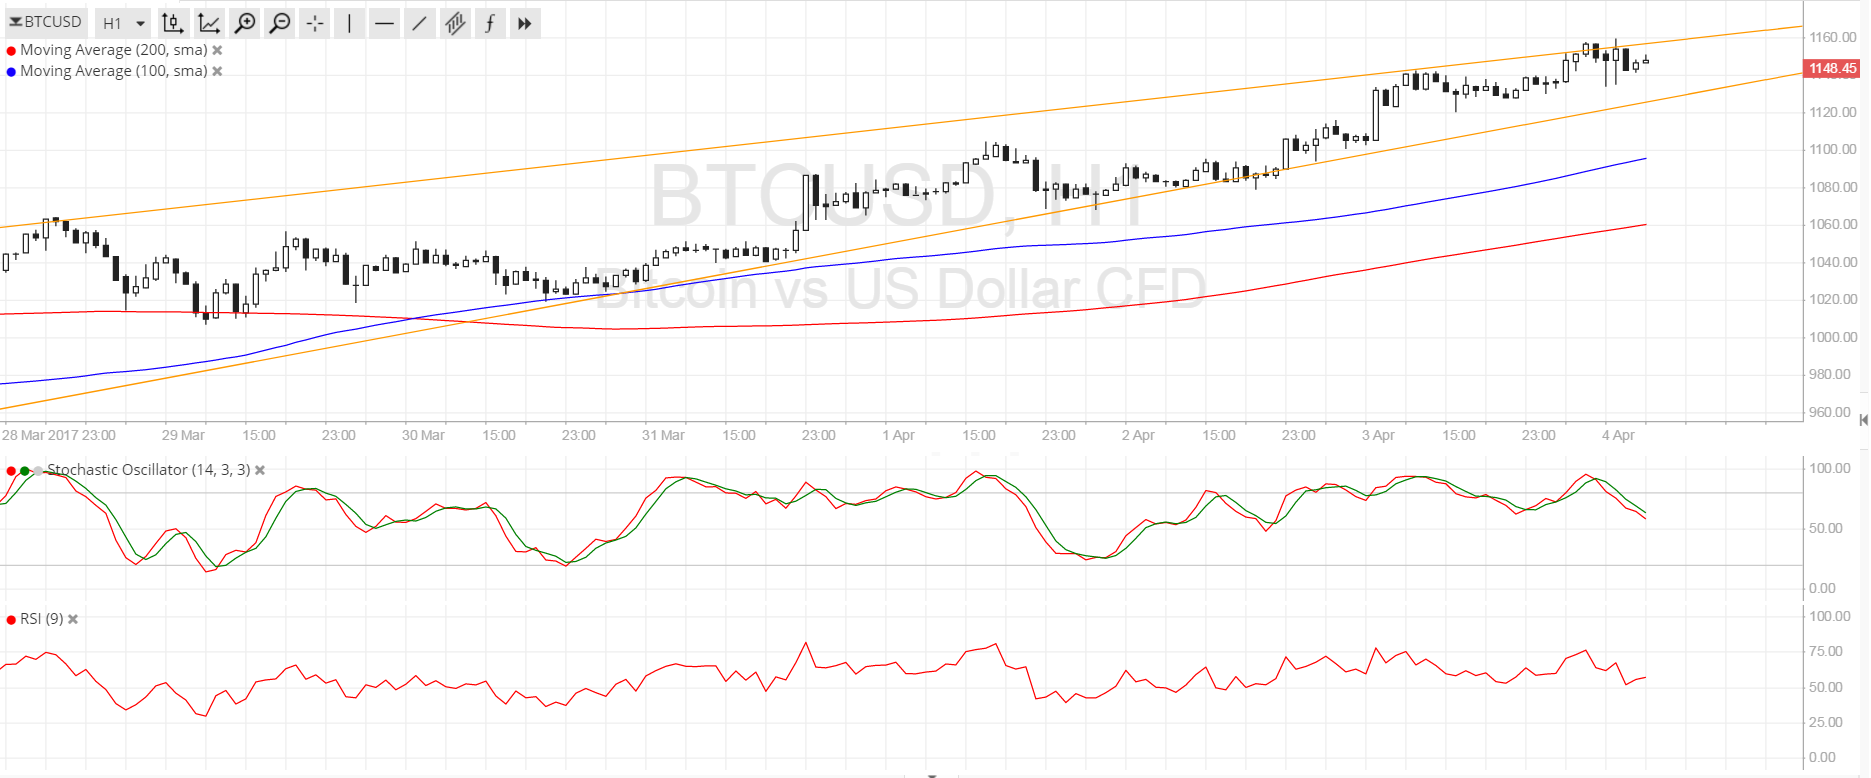
- Bitcoin price has formed higher lows and higher highs, moving in what appears to be a rising wedge pattern on the 1-hour chart.
- Price is currently testing the resistance and may be due for a pullback to support soon.
Bitcoin price is trending higher inside a rising wedge formation as bulls are slowly reestablishing their positions.
Technical Indicators Signals
The 100 SMA is above the longer-term 200 SMA so the path of least resistance is to the upside. The gap between the moving averages has been pretty steady so bullish momentum could be maintained and no signs of a potential downward crossover are materializing yet.
However, stochastic is turning down from the overbought zone and is already heading south so bitcoin price might follow suit. RSI is also on the move down to indicate that a bit of selling pressure could be seen. In that case, price could test the wedge support at $1130.
A break below this nearby floor could trigger a pullback to the 100 SMA dynamic support at the $1100 major psychological level. A larger correction could last until the 200 SMA dynamic inflection point at $1060. On the other hand, a strong push among bulls could lead to a break past the wedge resistance at $1160 and a move towards the $1200 barrier.

Market Events
Confidence in bitcoin was restored as cryptocurrency developers reached a consensus on how to handle the hard fork without resulting to incompatibilities or leaving old bitcoin to lose their value. Reports that a Canadian bitcoin exchange rejected Bitcoin Unlimited, or the newer version of the software, also gave investors more confidence that Bitcoin Core could continue to be implemented.
Aside from that, news that Japan is recognizing bitcoin as a legal payment method also boosted bitcoin price. This already began on April 1 and could be one of the major factors keeping price afloat in the coming weeks.
Charts from SimpleFX