Bitcoin Price Key Highlights
- Bitcoin price recently broke past a resistance level around the $1225 mark.
- Price is showing signs of pulling back, possibly finding a floor at the broken resistance.
- Technical indicators are hinting that the uptrend is slowing.
Bitcoin price could be due for a quick pullback to the area of interest at $1225 before heading further north.
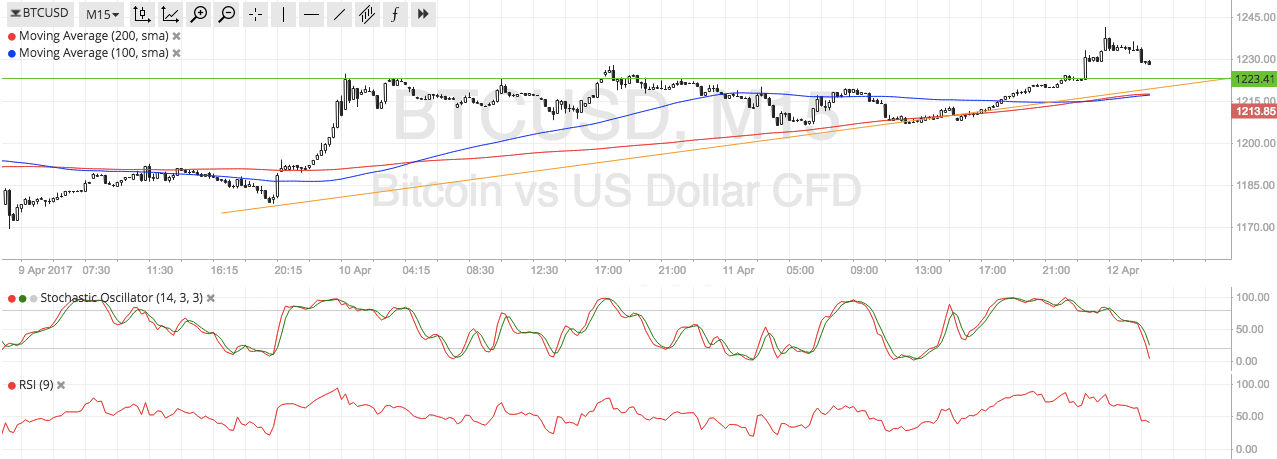
Technical Indicators Signals
The 100 SMA is below the longer-term 200 SMA so the path of least resistance could be to the downside. However, the downward crossover hasn’t gained much traction yet so there’s a chance that the MAs are just oscillating and that range-bound conditions could be seen.
Stochastic is heading south to show that sellers are on top of their game. RSI is also moving down so bitcoin price could follow suit. A larger pullback could last until the rising trend line connecting the lows of bitcoin price action so far this week, which is close to the moving averages dynamic support.
Once both oscillators indicate oversold conditions and turn higher, buyers could get back into action and push bitcoin price back up to the highs around $1240 and beyond.

Market Events
Bitcoin price has been gaining ground on speculations that Russia could recognize it as legal currency, following the Japanese government’s recent decision to do so. This would represent a complete change in view by Russian authorities that recently made moves to restrict bitcoin trading and information in the country.
If confirmed, this could open up a much larger market for bitcoin in the area. In addition, it could encourage other governments to take a less restrictive stance on bitcoin as opposed to potential oversight in China that dominated the headlines early this year.
Aside from that, bitcoin price has also been supported by persistent risk aversion as geopolitical tensions are present in the Middle East and in the Korean peninsula. If this market phenomenon persists, bitcoin price could test its record highs once more or even create new ones.
Charts from SimpleFX