Bitcoin Price Key Highlights
- Volatility seems to have calmed down for bitcoin price once more, as it is currently stalling around the mid-channel area of interest seen on longer-term time frames.
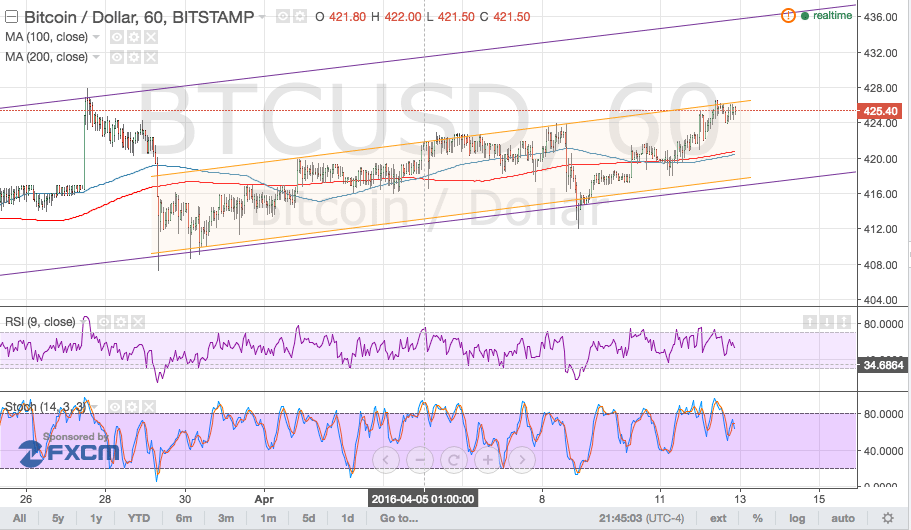
- Zooming in to the 1-hour chart shows that bitcoin is moving inside a short-term channel once more and is testing resistance.
- If this ceiling holds, another test of the long-term channel support near $420 could be seen.
Bitcoin price is having trouble sustaining its climb past this short-term resistance area, but a break higher could mean a move to the longer-term channel top.
Technical Indicators Signals
Technical indicators on the 1-hour time frame are suggesting that a selloff might take place. The 100 SMA is below the 200 SMA so the path of least resistance is to the downside, although these moving averages are also oscillating to indicate consolidation.
Meanwhile, RSI is pointing down, which means that bearish pressure is present. Similarly, stochastic just made its way down from the overbought zone so price might follow suit. Near-term support could also be found around the moving averages.

Market Events
The US dollar lost ground against most of its rivals in yesterday’s sessions when risk appetite improved. The primary factor is seen to be the strong surge in oil prices fueled by a news report suggesting that Saudi and Russia already struck a deal to freeze output.
Although the source was unnamed and no official confirmation has been given yet, the pickup in crude oil spurred hopes of a prolonged rally, increasing investors’ appetite for risk. Meanwhile, mixed results from US earnings reports have also given traders reason to let go of some of their dollar holdings.
Up ahead, more earnings reports are due throughout the week while the US economy is set to print its latest retail sales and PPI readings. Headline consumer spending could rise by 0.1% while core retail sales could post a 0.4% gain. However, weaker than expected data could mean more dollar declines and therefore another rally in bitcoin price.
Charts from Bitstamp, courtesy of TradingView