Bitcoin Price Key Highlights
- Bitcoin price is trending higher on short-term time frames but is still stuck in a consolidation pattern on the longer-term charts.
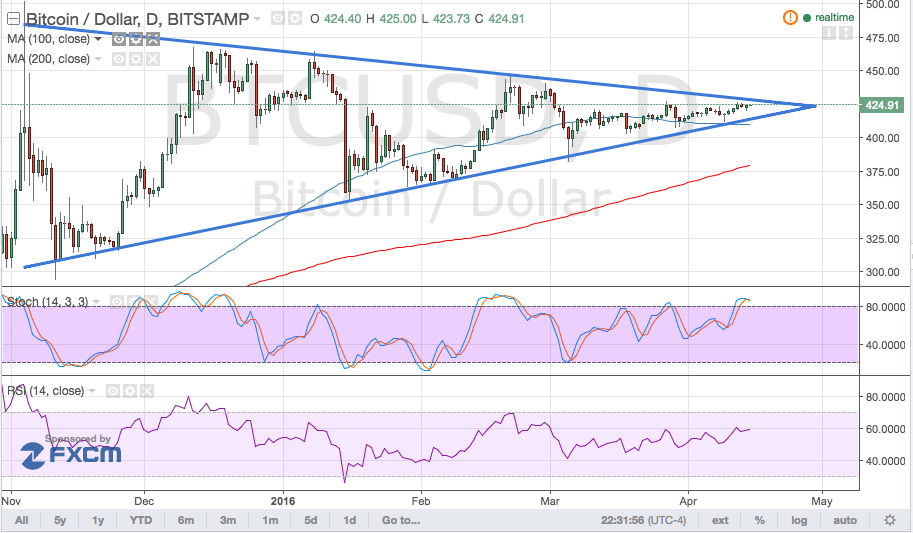
- Price is making its way back to the triangle resistance around $425.
- Technical indicators are giving mixed signals at the moment so consolidation might simply carry on.
Bitcoin price is moving inside a symmetrical triangle pattern with its lower highs and higher lows on the daily time frame.
Technical Indicators Signals
The 100 SMA is above the longer-term 200 SMA so the path of least resistance is still to the upside, suggesting that a break above the triangle top could be possible. However, the gap between these moving averages is narrowing, indicating a possible downward crossover.
Meanwhile, stochastic is indicating overbought conditions so buyers are already feeling exhausted from propping bitcoin price up. Once the oscillator turns down from the 80.0 level and starts heading further south, bitcoin price might follow suit.
RSI is still treading higher so there may be some buying pressure left. However, this indicator is also nearing the overbought levels so a return in selling momentum could take place sooner or later.

Market Events
The uncertainty in the financial markets is keeping bitcoin investors cautious these days, as there are several factors in play.
First there’s the upcoming Doha meeting on crude oil output which might have large-scale repercussions on commodity prices and global inflation. Next there’s the possibility of a Brexit and the looming Greek debt deadline, both of which could pose risks to growth and stability in Europe. Also, global growth concerns are still present with Chinese top-tier data due, Asian central banks shifting to an easing bias, and US data coming in weak.
In particular, retail sales, PPI, and CPI reports from the US all came in weaker than expected, which explains the slowing demand for dollars against bitcoin. If this phenomenon persists, bitcoin price could have a shot at breaking past the triangle resistance and resuming its climb to the previous year highs near $500 eventually.
Charts from Bitstamp, courtesy of TradingView