Bitcoin Price Key Highlights
- Bitcoin price has been trending higher on the 4-hour time frame, showing higher lows and higher highs.
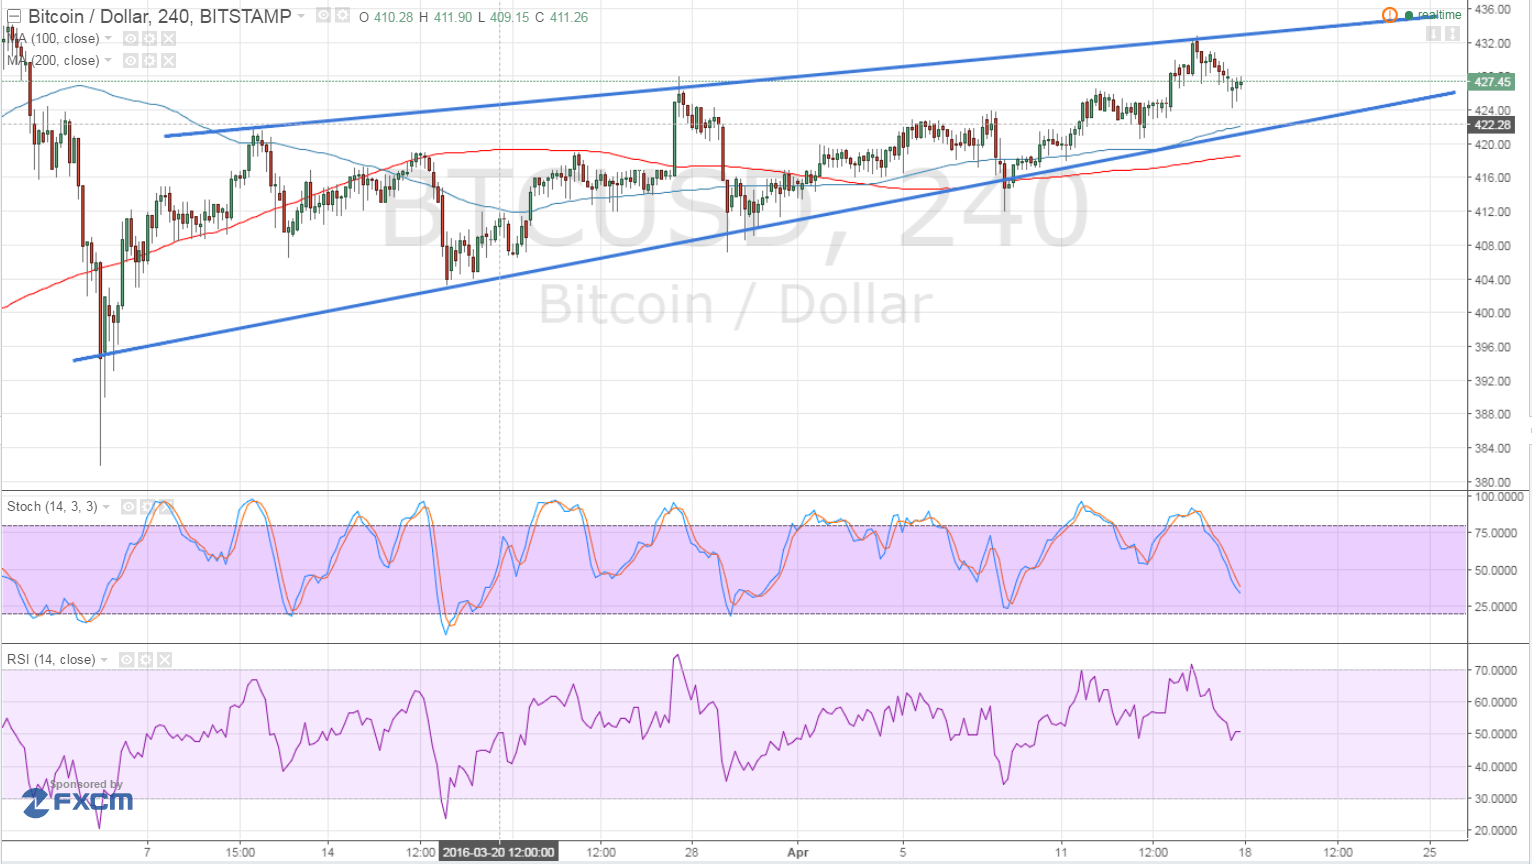
- A rising wedge pattern can be seen when connecting these latest highs and lows, with price just coming off a test of resistance.
- Another test of support around the $425 area could take place and a bounce could be seen.
Bitcoin price has been trading inside a rising wedge pattern as bullish pressure is present but weakening.
Technical Indicators Signals
The 100 SMA is above the longer-term 200 SMA so the path of least resistance is to the upside. In addition, the 100 SMA is in line with the wedge support so it’s likely that it could keep losses in check. A dip lower could draw support from the nearby 200 SMA.
Stochastic is on the move down so sellers are on top of their game. However, the oscillator is nearing the oversold level, which means that bearish pressure is about to be exhausted and buyers could gain the upper hand soon.
Similarly, RSI is on the move down and is halfway towards the oversold area so there’s enough selling pressure to trigger a test of the wedge support. But if bears continue to stay in control, bitcoin price could make a break below the formation and start a longer-term selloff, possibly until the longer-term support around $380-400.

Market Events
The weekend meeting among oil producers failed to produce a deal to cap oil production and keep prices supported. This spurred a wave of risk aversion early in the week, leading to stronger demand for the safe-haven dollar and a decline in bitcoin price.
Should this sentiment persist throughout the week, bitcoin could be under heavier selling pressure as investors price in a worse global economic slowdown on the heels of weaker oil prices. However, recent data from the US economy has also been weak, dulling the dollar’s shine in terms of fundamentals.
Event risks for the week include testimonies by central bank officials tomorrow, top-tier UK data, and the ECB interest rate decision.
Charts from Bitstamp, courtesy of TradingView