Bitcoin Price Key Highlights
- Bitcoin price recently broke below an ascending trend line on its 4-hour time frame, signaling that bearish pressure is in play.
- Price could be due to pull back to the broken support area, which might now hold as resistance.
- If so, bitcoin price could resume its drop to support at the $1200 mark or even lower.
Bitcoin price seems to be gearing up for a correction to a broken trend line support before resuming its slide.
Technical Indicators Signals
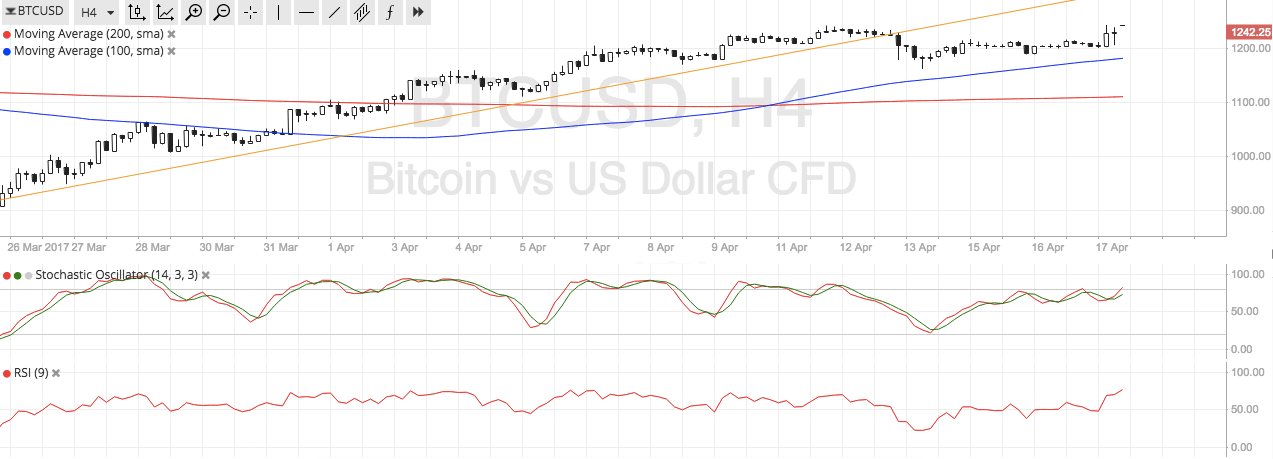
The 100 SMA is above the longer-term 200 SMA on the 4-hour chart, which means that the path of least resistance is to the upside. The gap between the moving averages is getting wider to indicate a buildup in buying pressure. However, there is nearby resistance at the broken ascending trend line around $1250.
Stochastic is still pointing up to indicate that buyers are in control of price action until the oscillator starts indicating overbought conditions. RSI is also moving up so bitcoin price might follow suit. Stronger bullish momentum could take bitcoin back above the rising trend line support and on track towards testing the record highs closer to $1300 or perhaps creating new ones.

Market Events
Several market factors such as geopolitical risks continue to keep bitcoin price supported as traders pursue higher-yielding assets outside of traditional financial securities. In addition, the lack of negative news pertaining to increased regulation or any complications related to the network hard fork has allowed investors to renew their bullish bias on the cryptocurrency.
The upcoming French elections is also keeping uncertainty in play as talks of Frexit have led several traders to move money out of European markets and onto bitcoin. Apart from Le Pen, other frontrunners are also said to have similar ideas that might threaten the existence of the shared currency in the future. In another part of the world, demonetization in India has led majority of ATMs to run dry and leave people in search for an alternative payment method or store of value.
Charts from SimpleFX