Bitcoin Price Key Highlights
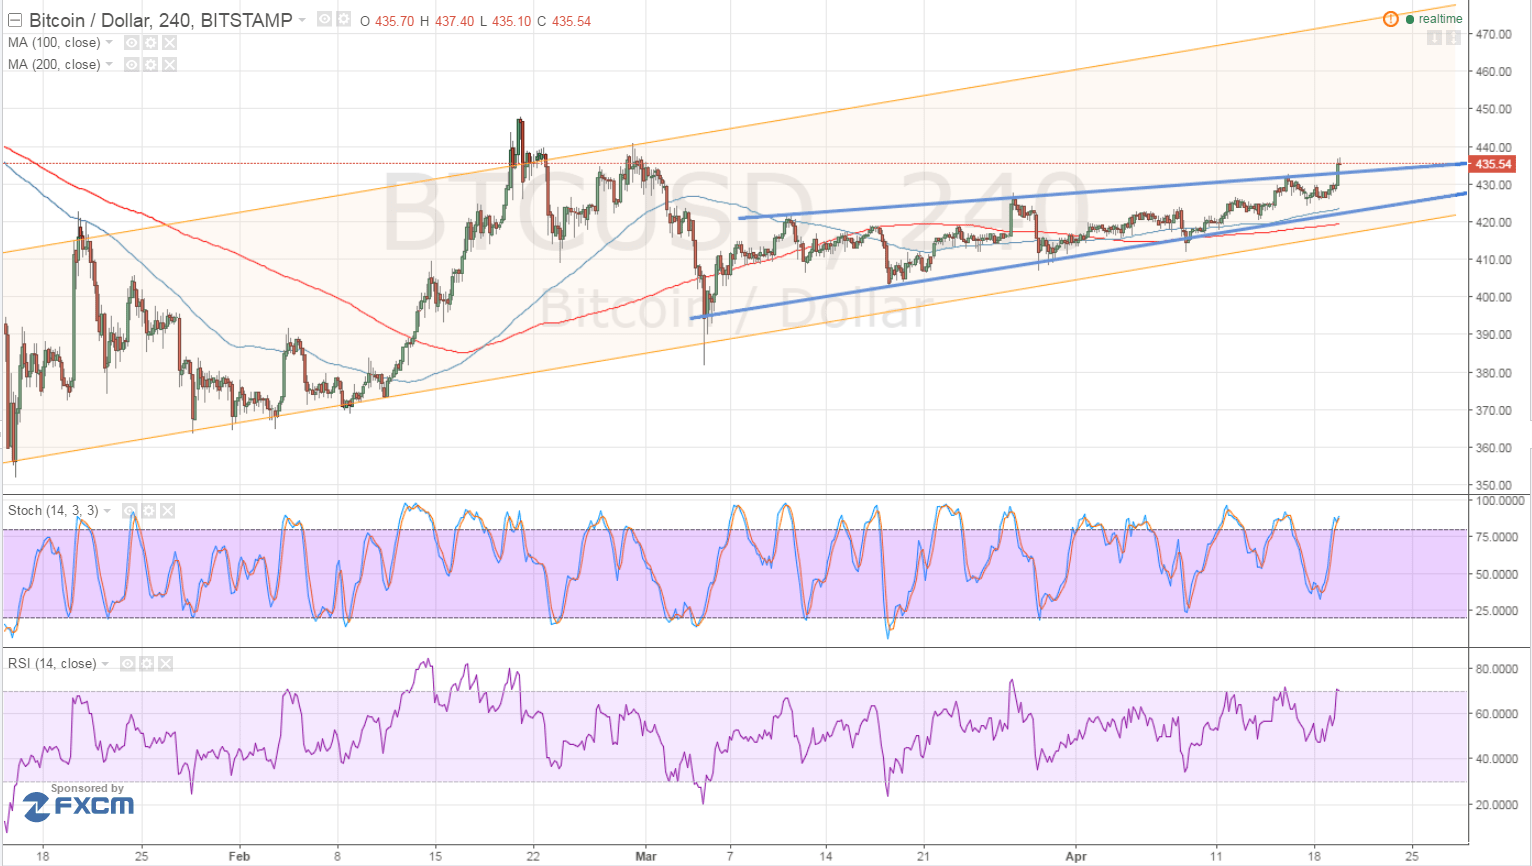
- Bitcoin price just broke above the top of the rising wedge pattern highlighted in yesterday’s update.
- This upside breakout suggests that bitcoin could be ready for more gains with bullish momentum picking up.
- Zooming out to the longer-term time frames shows that next possible resistance areas.
Bitcoin price broke out of its short-term consolidation pattern and is eyeing further upside, possibly until the long-term channel resistance.
Technical Indicators Signals
The 100 SMA is still above the longer-term 200 SMA, confirming that the path of least resistance is to the upside. The rising wedge pattern spans $400-420 so the resulting rally could last by $20 until $455-460, which is also around an area of interest and former support.
The top of the rising channel on the 4-hour chart is located around $470 so bitcoin price might need a lot of bullish pressure before reaching that level. For now, stochastic is almost in the overbought region, which suggests that buyers might need to take a break soon.
Similarly, RSI is nearing the overbought levels and turning lower could bring sellers back in the mix. In that case, a pullback to the broken wedge resistance could take place while a stronger return in bearish momentum could lead to another test of the wedge or channel support.

Market Events
The dollar has weakened against its counterparts for yet another day, as traders reacted to downbeat US building permits and housing starts data. US reports have been mostly weaker than expected so investors might be pricing in a dovish rhetoric from the FOMC next week.
Meanwhile, the rally in commodities has supported bitcoin price, with market participants flocking to higher yields. US oil supply has increased by 3.1 million barrels according to the API while the end of the oil strike in Kuwait means a return to production. Even so, crude oil has managed to hold on to its current levels, keeping risk appetite in play in the financial markets.
Charts from Bitstamp, courtesy of TradingView