Bitcoin Price Key Highlights
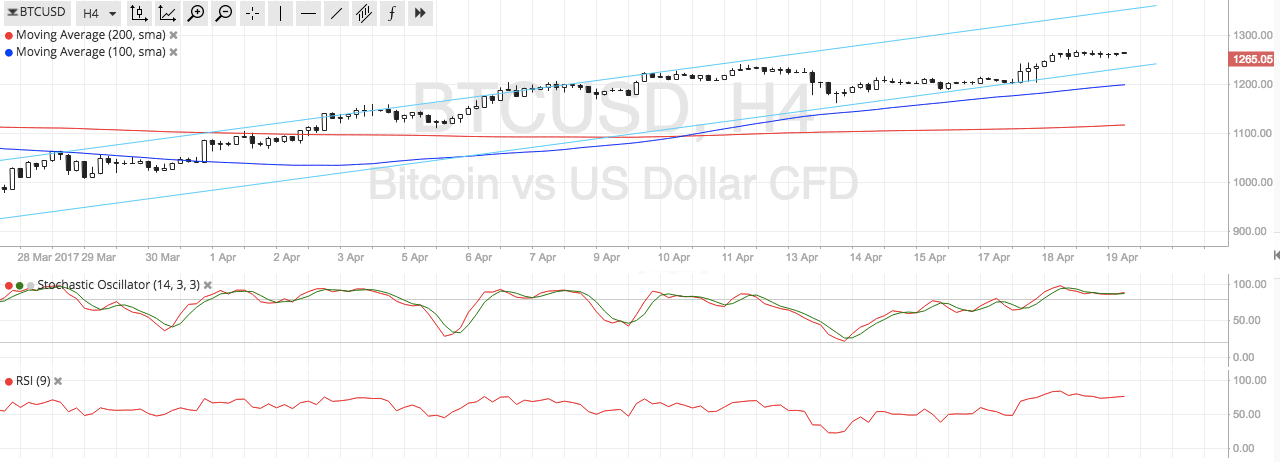
- Bitcoin price is trading inside an ascending channel formation visible on its 4-hour time frame.
- Price just bounced off support and could be due for a test of resistance at the $1350 level.
- Bitcoin is currently stalling at the mid-channel area of interest close to its record highs while technical indicators are giving mixed signals.
Bitcoin price is still on an uptrend but is encountering some resistance at the middle of its ascending channel formation.
Technical Indicators Signals
The 100 SMA is above the longer-term 200 SMA on the 4-hour chart so the path of least resistance is to the upside. Also, the gap between the moving averages is getting wider, which means that buying pressure is getting stronger. The 100 SMA is close to the bottom of the channel, adding to its strength as a floor in the event of a pullback to the $1200 area.
Stochastic is indicating overbought conditions, which means that buyers are exhausted and that sellers could take over as soon as the oscillator heads south. RSI is also in the overbought area so bitcoin price could fall once the indicator turns lower. If support at the bottom of the channel breaks, bitcoin price could still find a floor at the 200 SMA dynamic support at $1100.

Market Events
Global uncertainties continue to keep bitcoin price supported as investors are in search of higher-yielding alternative assets outside of traditional financial markets. After all, Europe has the upcoming French elections to contend with, along with the snap elections in the United Kingdom.
Keep in mind, however, that Chinese regulation is once again making its way into bitcoin headlines as OKCoin just recently froze US dollar deposits, following Bitfinex’s announcement that it wouldn’t be able to accept transfers. “Please do not make further deposits as your wires may be rejected by intermediary banks,” a statement posted on the exchange’s website stated, reminding market watchers of stricter oversight and crackdowns being conducted by Chinese authorities.
Charts from SimpleFX