Bitcoin Price Key Highlights
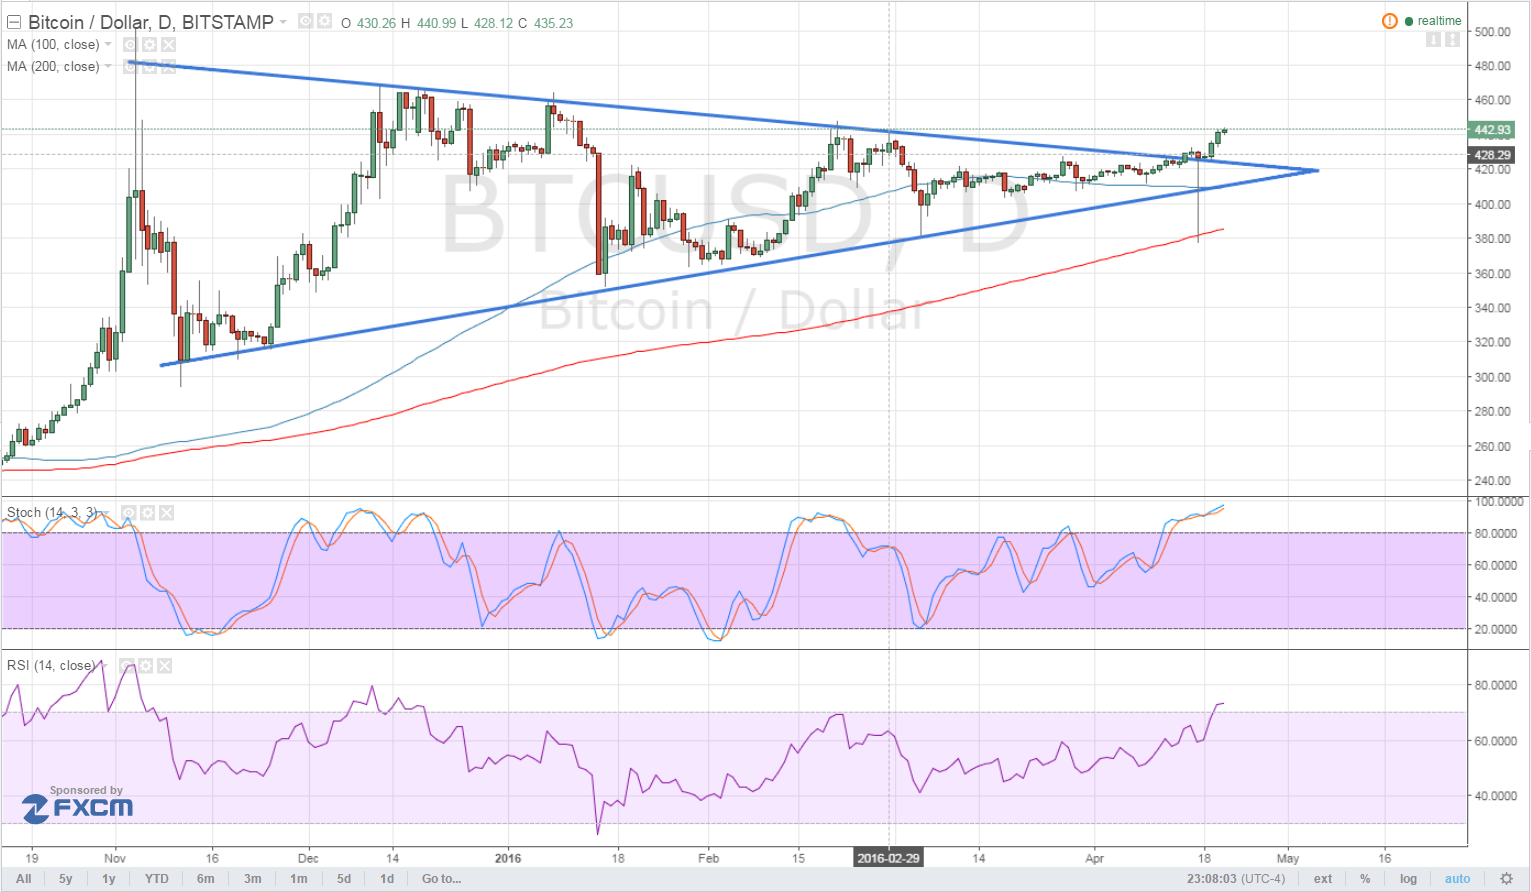
- Bitcoin price had been trading inside an symmetrical triangle formation on its daily time frame, but it looks like a breakout has finally taken place.
- Price rallied past the triangle resistance at the $440 area and might be in for a longer-term uptrend.
- Bitcoin is currently testing the near-term resistance near $450 and a break higher could take it to the next ceiling around $460.
Bitcoin price made an upside breakout from its long-term consolidation pattern, signaling that it’s ready to go for more gains.
Technical Indicators Signals
The 100 SMA is above the 200 SMA, confirming that the path of least resistance is to the upside and that further gains are in the cards. However, the gap between the two moving averages is narrowing so a downward crossover might eventually take place.
Stochastic is already indicating overbought conditions so buying pressure could weaken soon. RSI is also moving close to the overbought region, which means that buyers might need to take a break and let sellers take over. If so, bitcoin price could retreat to the broken triangle resistance before heading further north.
Stronger selling momentum could lead to a larger drop to the triangle support around $415-420 or even a downside break.

Market Events
Traders have been lightening up on their dollar holdings recently, as risk appetite has improved. Also, data from the US economy has been mostly weaker than expected so investors might be pricing in downbeat comments from the FOMC in their statement next week.
Commodity prices have been able to hold on to their gains, keeping higher-yielding assets supported. Reports due today include the Philly Fed index and initial jobless claims, both of which are expected to show weaker results compared to their earlier readings, possibly triggering further dollar weakness.
Another event risk for today is the ECB interest rate statement. Even though no actual policy changes are expected, their tone could impact overall market sentiment.
Charts from Bitstamp, courtesy of TradingView