Bitcoin Price Key Highlights
- Bitcoin price recently made an upside breakout from a long-term consolidation pattern highlighted on the longer-term time frames.
- This signals that bulls have gotten the upper hand and might have enough energy to push for more gains.
- However, price appears to have encountered a near-term ceiling at $450 and might need to pull back to the broken resistance.
Bitcoin price is on track for a longer-term climb but bulls might need a retracement to gather more steam.
Technical Indicators Signals
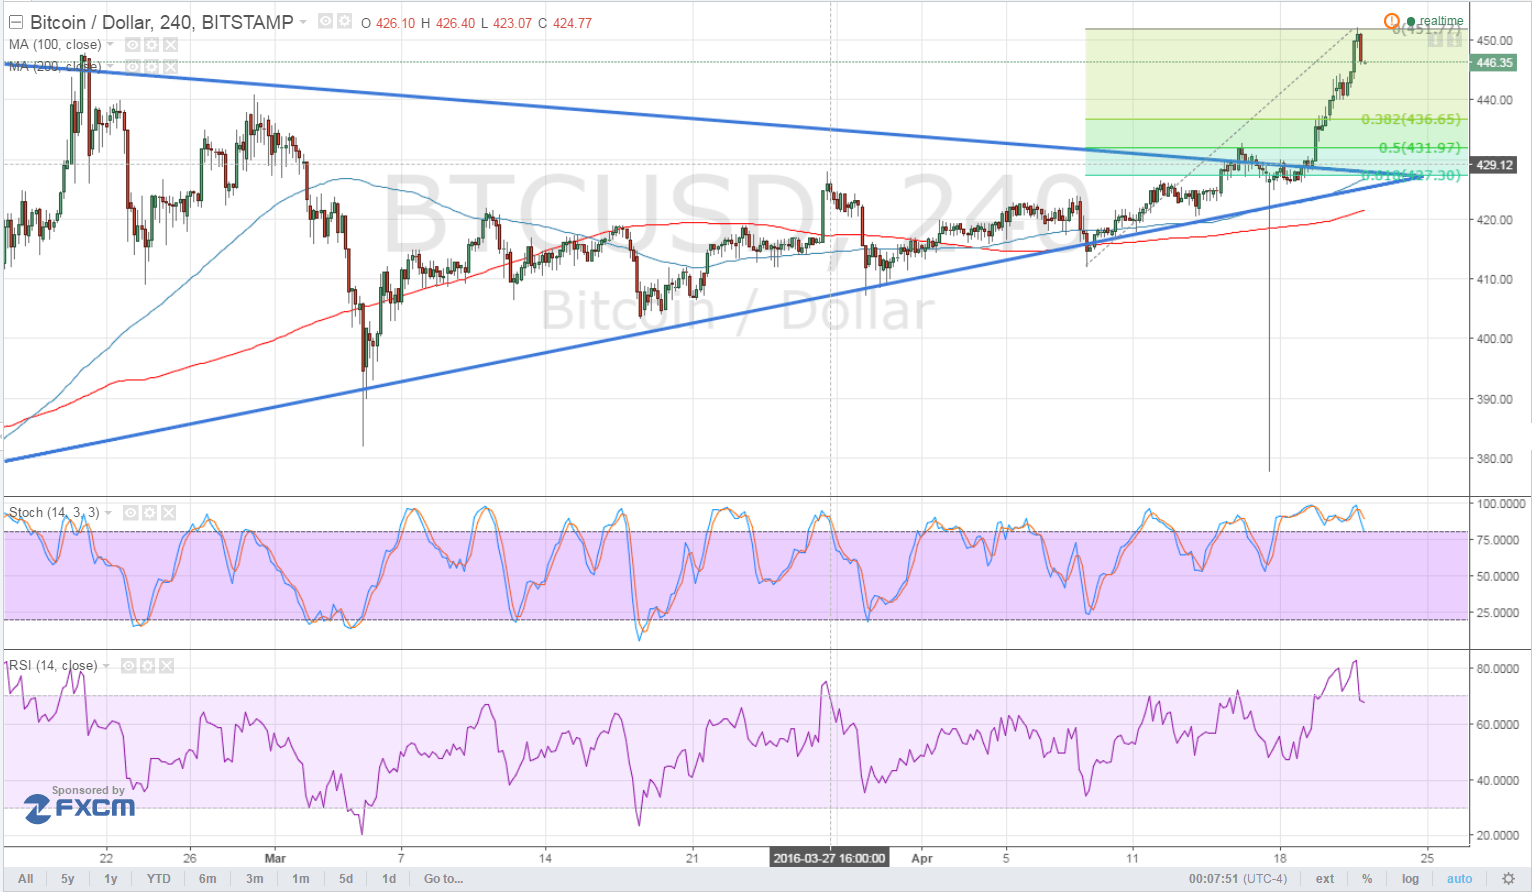
The 100 SMA is still above the longer-term 200 SMA, confirming that the path of least resistance is to the upside. Also, the 100 SMA lines up with the broken triangle resistance, which might hold as support moving forward.
Applying the Fibonacci retracement tool on the latest swing high and low shows that the 61.8% level lines up with the 100 SMA and triangle resistance. A large pullback could last until that area but a shallow correction could find support at the 38.2% Fib or $435 level.
Stochastic is indicating overbought conditions and is turning lower, showing that profit-taking could take place around the recent levels and that sellers might take control from here. In addition, RSI is also heading south from the overbought zone so price might follow suit.
If any of the Fib levels hold as support, bitcoin price could revisit its previous highs at $450 or create new ones.

Market Events
The US dollar has lost a lot of ground to its higher-yielding peers recently, as commodity prices have climbed and US earnings figures have been mixed. In addition, traders might be pricing in downbeat remarks from the FOMC in their interest rate statement next week.
No actual monetary policy changes are expected for now so market watchers will pay close attention to the Fed’s bias. Data from the US economy, particularly CPI and retail sales, have been weaker than expected last week so there’s a good chance that policymakers might sound more cautious than usual.
Charts from Bitstamp, courtesy of TradingView