Bitcoin Price Key Highlights
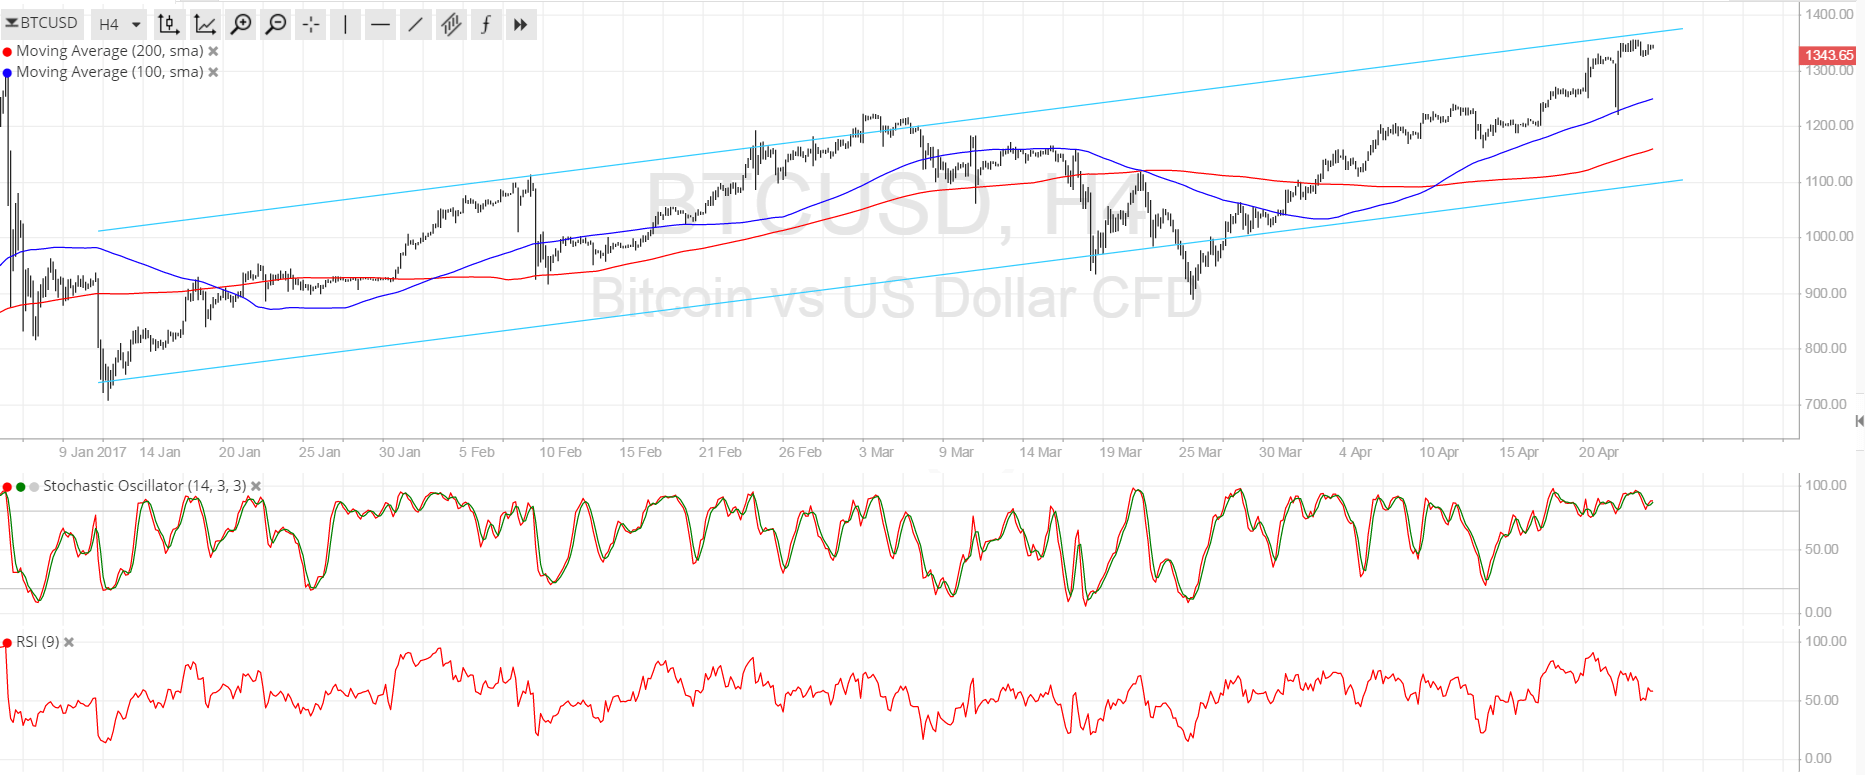
- Bitcoin price is still trading inside its ascending channel formation and is testing the $1400 resistance as predicted earlier.
- Price could be due for a quick selloff from here as bulls book profits off this strong ceiling.
- If so, bitcoin price could make a pullback that might draw more buyers in and allow the climb to resume.
Bitcoin price is on an uptrend on its short-term and long-term charts but could undergo a correction after some profit-taking activity.
Technical Indicators Signals
The 100 SMA is above the longer-term 200 SMA on this 4-hour chart so the path of least resistance is to the upside. In addition, the 100 SMA has recently held as dynamic support and could continue to do so. The gap between the moving averages is getting wider to show increased bullish pressure.
Stochastic is indicating overbought conditions, which reflects rally exhaustion and hints that selling momentum could come into play. RSI is also in the overbought area and is already turning lower to suggest that bears are trying to regain the upper hand. If so, another pullback to the nearby 100 SMA support at $1250 or to the 200 SMA dynamic inflection point at $1150 could be underway. A larger correction could last until the channel bottom at $1100.

Market Events
Traders are now turning their attention to the tax reform plan to be unveiled by President Trump on Wednesday as this might provide support for US assets, including the dollar. Still, there’s a chance for disappointment as the details could fall short of market expectations and there’s also the question of how long it would take before the changes are implemented.
As for bitcoin itself, the lack of negative news has proved positive for the cryptocurrency as there have been no new regulations from China so far nor any troubles from the network hard fork. With that, the path of least resistance in terms of fundamentals is also to the upside, pending any major surprises from the headlines this week.
Charts from SimpleFX