Bitcoin Price Key Highlights
- Bitcoin price is now testing the $1400 mark at the top of the ascending channel as indicated in the previous article.
- Price could head back to the short-term channel support at $1375 for a quick pullback to draw more buyers in before the uptrend resumes.
- A bounce off this near-term support could lead to another test of resistance or even a break higher for a steeper climb.
Bitcoin price climbed all the way up to the channel resistance at $1400 and could be due for more gains after a quick correction.
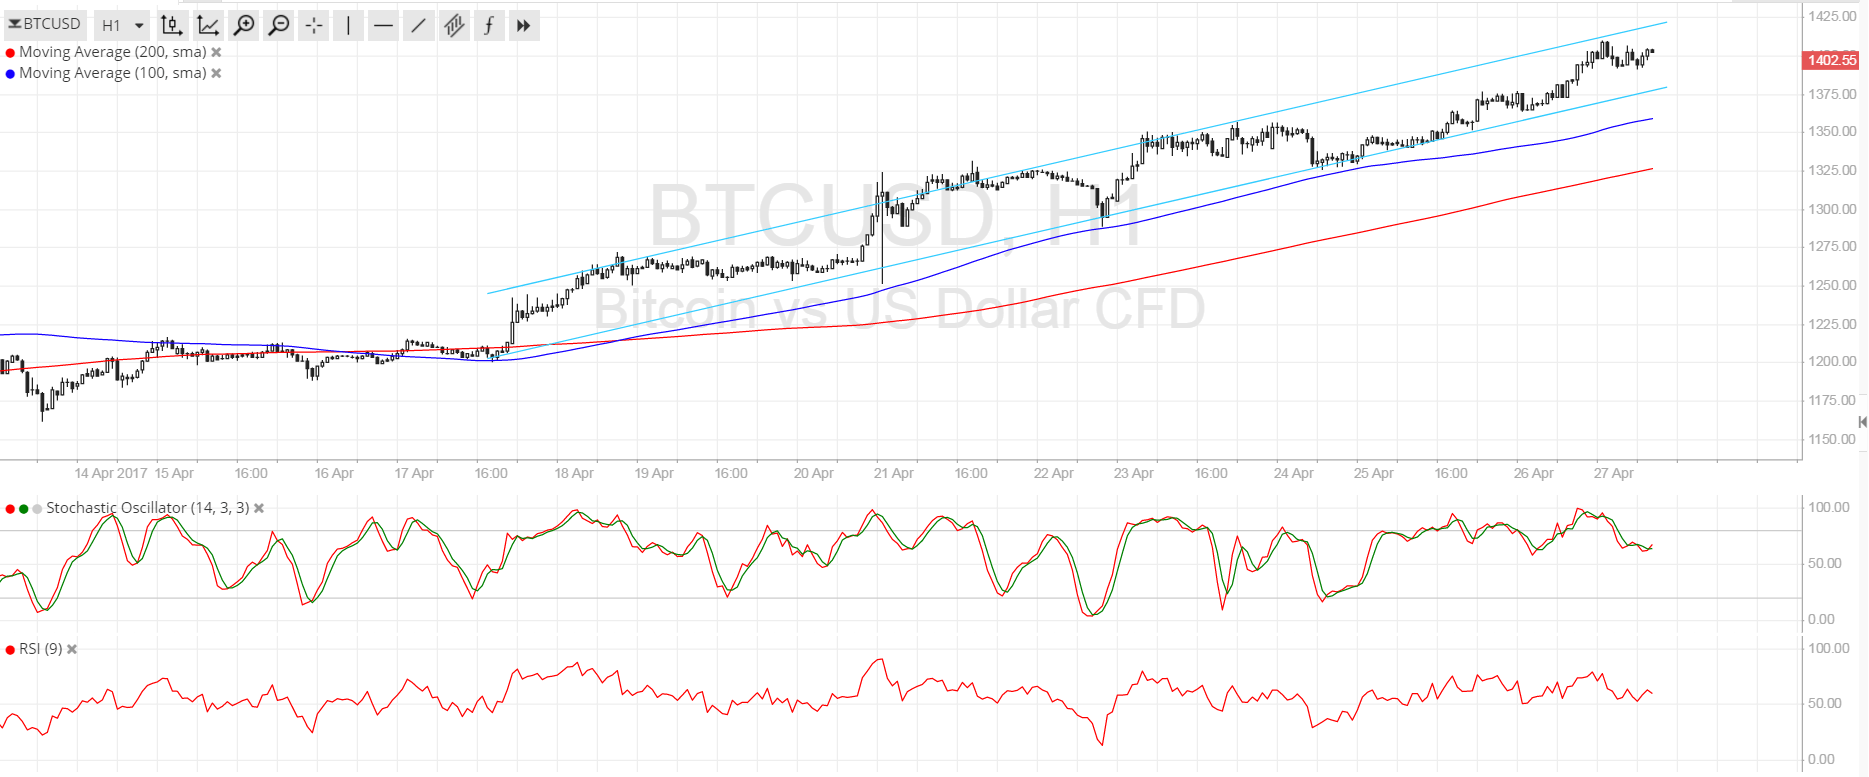
Technical Indicators Signals
The 100 SMA is above the longer-term 200 SMA on this time frame so the path of least resistance is to the upside. In addition, the 100 SMA is close to the bottom of the channel, adding to its strength as potential support in the event of larger pullback.
Meanwhile, the 200 SMA is closer to $1325, which might be the line in the sand for this uptrend. Note that the gap between the moving averages is narrowing to suggest weaker buying pressure and a potential downward crossover.
Stochastic is turning down from the overbought zone to reflect a pickup in bearish momentum while buyers take it easy. RSI also appears to be heading south so bitcoin price might follow suit. A break below the 200 SMA could confirm that a longer-term drop or pullback is underway.

Market Events
Market watchers appear to have been disappointed by the Trump administration’s tax reform plan as it fell short on details and contained nothing new from previous speculations. This includes reducing the tax brackets, cutting the corporate tax down to 15% and reducing the tax burden on middle-income American families.
With that, the attention is now shifting back to political headlines and the next US event risk on deck, namely the advanced GDP reading for Q1. Analysts are expecting to see a 1.3% growth figure, a few notches below the earlier 2.1% GDP reading. Weaker than expected results could undermine dollar gains and Fed rate hike hopes, thereby boosting bitcoin price.
Charts from SimpleFX