Bitcoin Price Key Highlights
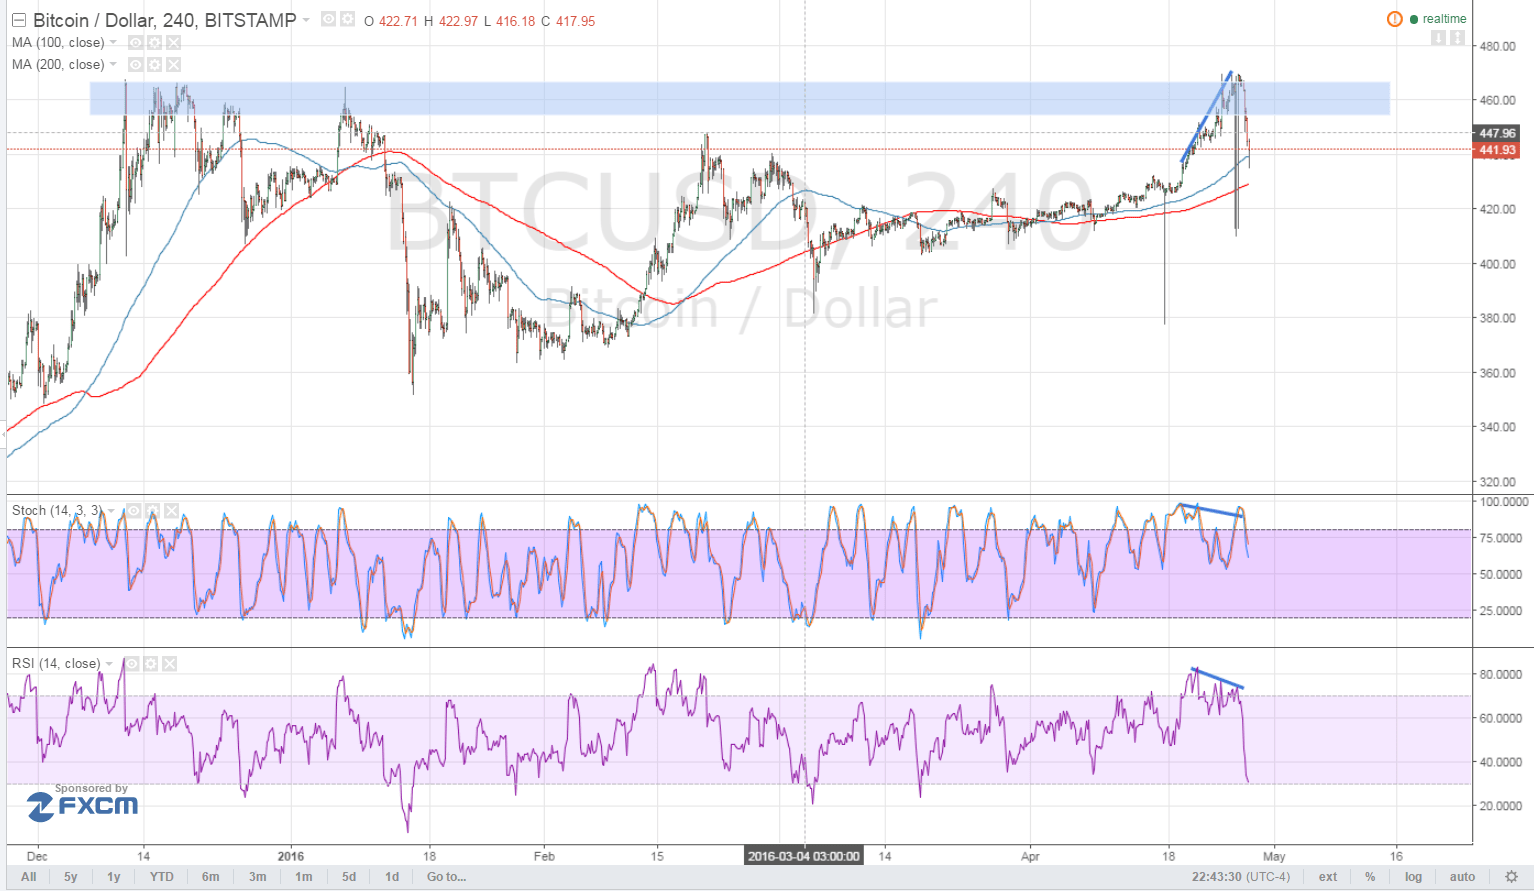
- Bitcoin price tested the $460 level and resistance held as predicted in the previous article.
- The bearish divergence played out as well, taking price down to the nearby area of interest at $440.
- More downside could be expected but technical indicators are giving mixed signals.
Bitcoin price turned upon hitting the resistance at $460 as hinted by the bearish divergence.
Technical Indicators Signals
The oscillators fell from the overbought regions to indicate a return in bearish momentum. RSI is nearing the oversold area so profit-taking might happen but stochastic has a long way to go, which suggests that sellers could be in control for a long while.
However, the 100 SMA is still above the longer-term 200 SMA so a bounce is still possible. Bitcoin price is still on top of the trend line drawn to connect the lows since late January this year so the uptrend could resume from here.
Volatility was also in play during the FOMC statement as predicted, taking price down to the $420 area of interest, which held as strong support. If bears are unable to push for a strong break below this area, bulls could eventually get back in the game and push for another test of the $460 resistance. On the other hand, sustained selling pressure could lead to a drop to the $380-400 levels.

Market Events
The FOMC decided to keep interest rates unchanged but refrained from providing any clues as to whether they’re inclined to hike in June or not. Their official statement no longer contained the phrase on global financial risks but policymakers shifted to a less upbeat tone when discussing economic growth and inflation.
With that, market watchers might be hesitant to pile on long dollar positions in anticipation of a June interest rate hike. If US data continues to disappoint, traders could continue unwinding their dollar trades and allow bitcoin price to resume its climb.
The US advanced GDP reading is up for release today and a 0.7% growth figure is eyed, half of the previous 1.4% expansion.
Charts from Bitstamp, courtesy of TradingView