Bitcoin Price Key Highlights
- Bitcoin price seems unstoppable in its climb, possibly forming a wider ascending channel on its long-term charts.
- Price has surged to new record highs past the $1400 mark, which is around the mid-channel area of interest.
- Bitcoin price might be aiming for the $1600 channel resistance next as the uptrend remains intact.
Bitcoin price seems to be setting its sights higher to $1600, but oscillators are hinting that profit-taking is bound to happen soon.
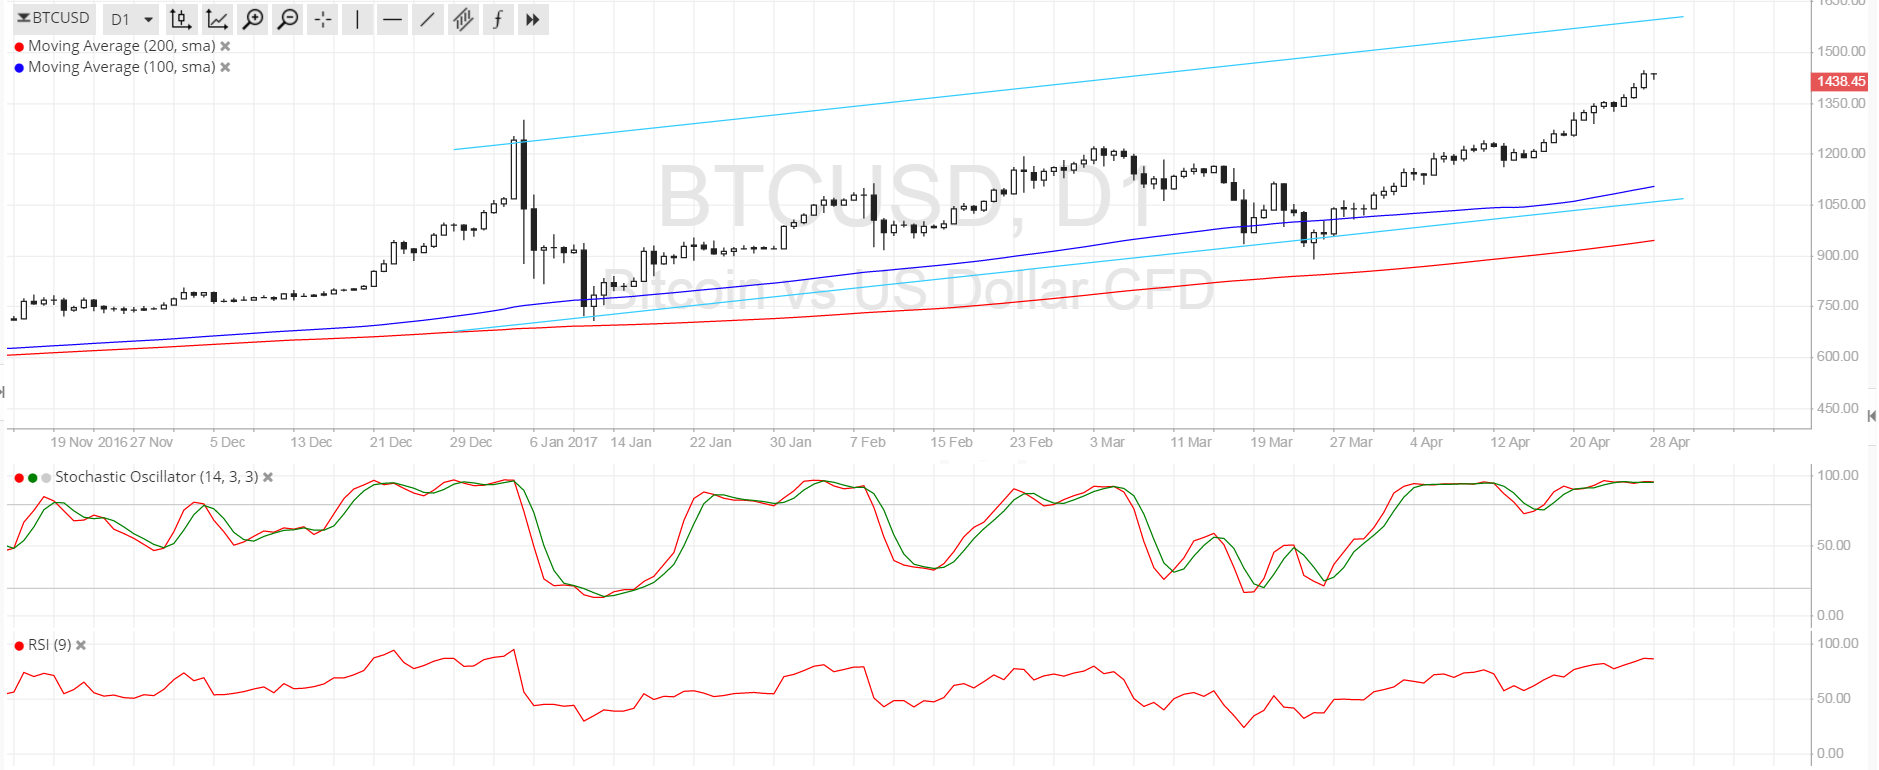
Technical Indicators Signals
The 100 SMA is still above the longer-term 200 SMA on the daily chart, confirming that the path of least resistance is to the upside. In addition, the 100 SMA lines up with the channel support at $1100, adding to its strength as a floor in the event of a pullback. The gap between the moving averages has widened again to show a pickup in bullish pressure.
However, stochastic has been indicating overbought conditions for quite some time so there’s a chance that bears could take over bitcoin price action. RSI is still on the move up to indicate that there’s some buying momentum left but is also nearing the overbought zone. Once both oscillators turn down, bitcoin price might follow suit for a short-term correction.

Market Events
Market participants seem to be moving away from US assets as the Trump administration’s tax reform plan was a dud. Apart from that, the upcoming advance GDP release is projected to print a weaker growth figure of 1.3% compared to the previous period’s 2.1% expansion, with a lower than expected result likely to douse Fed rate hike expectations for the coming months.
Meanwhile, indications that the SEC is willing to give the Winkelvoss bitcoin ETF another shot is currently lifting bitcoin price. This was seen leading up to the regulator’s decision earlier this year as approval would drastically boost market interest and liquidity for bitcoin. In addition, it could also open the door for more bitcoin securities to be introduced.
Charts from SimpleFX