Bitcoin Price Key Highlights
- Bitcoin price is keeping up with its climb and is setting its sights higher to the top of the ascending channel on its daily time frame.
- Price could reach $1400 sooner or later, with technical indicators signaling that the uptrend could continue.
- Some signs of rally exhaustion are seen but there have been no indications of a return in bearish momentum just yet.
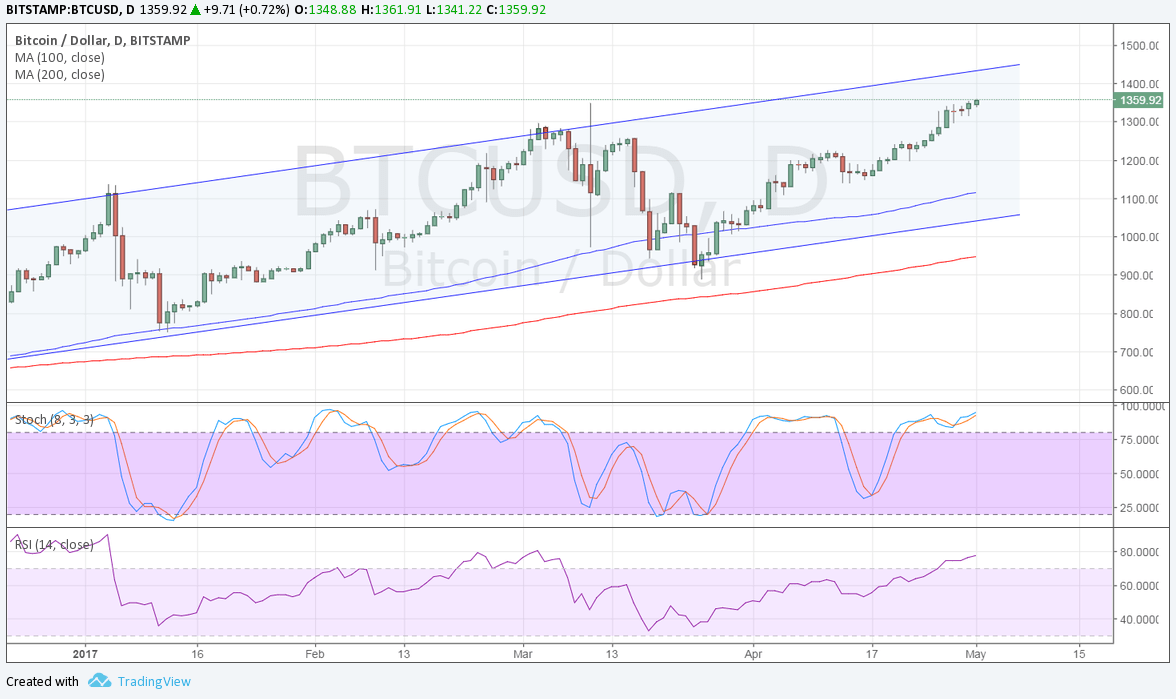
Bitcoin price continues to head further north and appears to be aiming for the ascending channel resistance at $1400.
Technical Indicators Signals
The 100 SMA is above the longer-term 200 SMA so the path of least resistance is still to the upside. Also, the gap between the two keeps widening to reflect stronger bullish momentum. This could be enough to push bitcoin price all the way up to the channel resistance before profit-taking happens.
Stochastic is already indicating overbought conditions, which suggests that buyers are feeling exhausted. Similarly, RSI is in the overbought area to indicate that bullish pressure is fading. However, both oscillators have yet to cross below the overbought region and turn lower to reflect a return in selling momentum.
A pullback could last until the channel support at $1100, which is close to the 100 SMA dynamic support. A shallow correction could find a floor at the $1200-1250 mid-channel area of interest before resuming the climb.

Market Events
The dollar once again gave up ground on Friday when the advance GDP reading turned out weaker than expected. The economy grew by only 0.7%, almost half the projected 1.3% figure and significantly lower than the earlier period’s 2.1% expansion. This casts doubt that the Fed can be able to hike rates two more times this year, especially with weaker expectations of Trump’s tax reform being enacted before the end of 2016.
Meanwhile, bitcoin price continues to gain further upside traction on renewed hopes that the Winklevoss COIN ETF could eventually see approval from the SEC. Last week, news broke out that the regulator is looking to conduct another review of the proposal and lifted the cryptocurrency.
Charts from SimpleFX