

Bitcoin Price Key Highlights
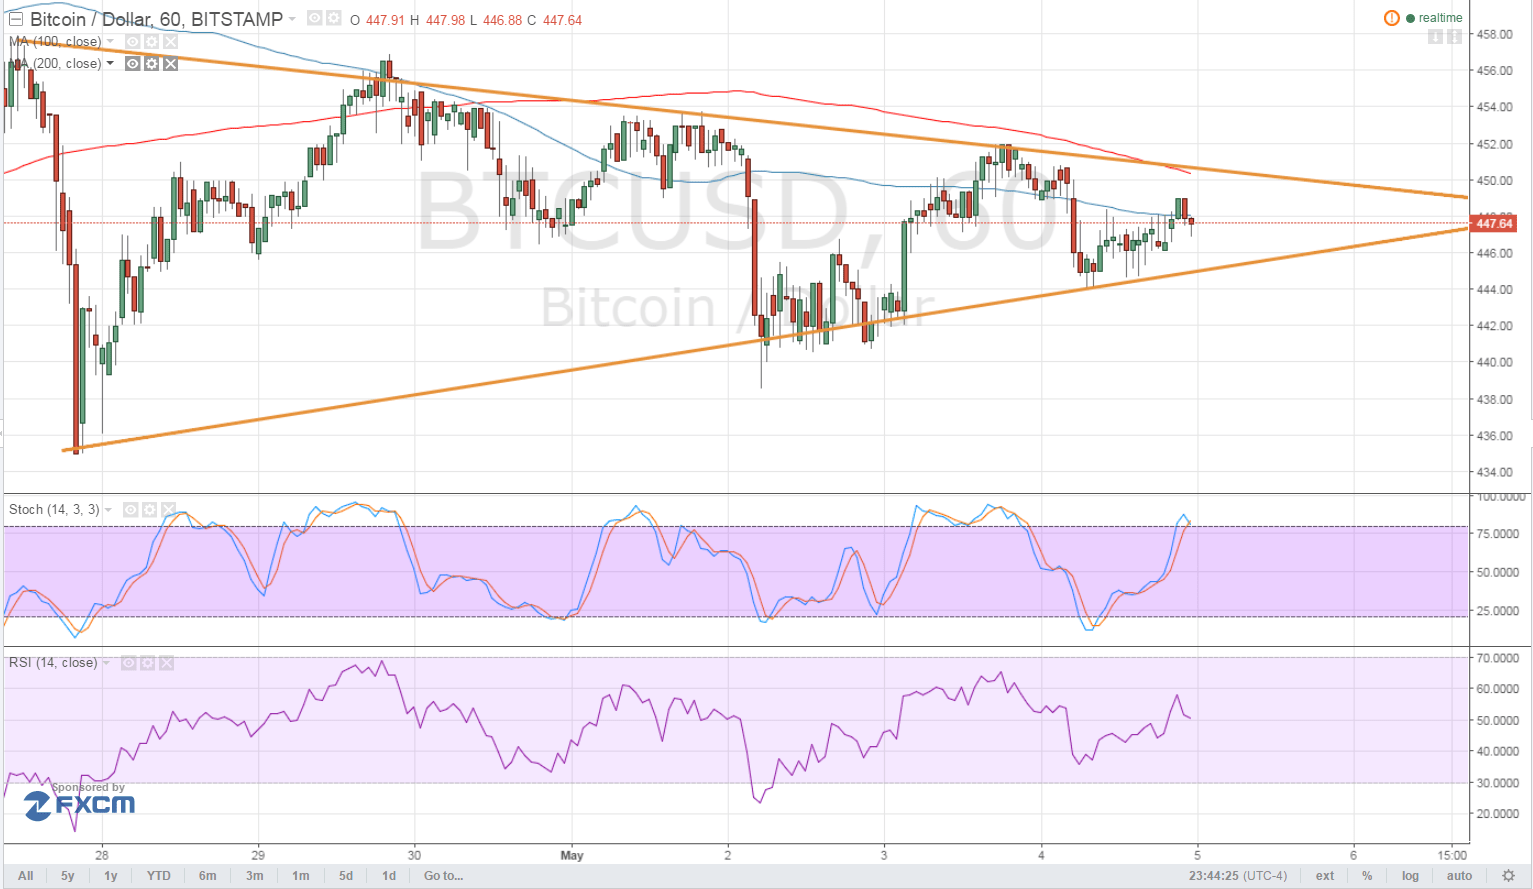
- Bitcoin price bounced off the symmetrical triangle support as predicted in the earlier blog post.
- Price is now setting its sights back on the triangle resistance around $450.
- Technical indicators are suggesting that a selloff might be in order.
Bitcoin price is moving inside a symmetrical triangle consolidation pattern and is on track towards testing the resistance.
Technical Indicators Signals
The 100 SMA is below the longer-term 200 SMA, confirming that the path of least resistance is to the downside and that the triangle resistance near $450 is likely to hold. In addition, the 200 SMA lines up with the top of the triangle as a dynamic resistance level.
For now, price is encountering some resistance at the 100 SMA and if this holds, another test of the support could take place. Stronger selling momentum might even trigger a downside breakout.
Stochastic looks ready to turn down from the overbought region, possibly indicating a return in selling pressure. RSI is already pointing down and heading south so bitcoin price could follow suit. Keep in mind that bitcoin price came from a sharp drop following a test of the longer-term resistance at $470.

Market Events
Data from the US economy came in mixed yesterday, with traders paying particular attention to the ADP non-farm employment change. The report showed a 156K gain in hiring for April, much lower than the estimated 205K increase. This suggests a likely downside surprise for the NFP report, although the employment components of both the ISM manufacturing and non-manufacturing surveys showed gains.
An upbeat NFP result could be enough to spur dollar demand against bitcoin price, and this could let the near-term resistance keep gains in check. Significantly downbeat readings, however, could remind traders of the lower odds of a June Fed rate hike and lead to a sharp dollar selloff or an upside breakout from the triangle pattern.
Be on the lookout for any volatile moves on Friday, as bitcoin price has made a few spikes here and there during top-tier events in the US.
Charts from Bitstamp, courtesy of TradingView
Header Image courtesy of NewsBTC