Bitcoin Price Key Highlights
- Bitcoin price reached new record highs but quickly tumbled in an hour as traders likely booked some profits at $1600.
- A bigger pullback could be in the cards if uncertainties linger, offering a chance for more buyers to get in the game.
- The rising trend line on the 4-hour time frame remains intact and could be a good correction area.
Bitcoin price tossed and turned as it was pulled by opposing market forces and influenced by profit-taking recently.
Technical Indicators Signals
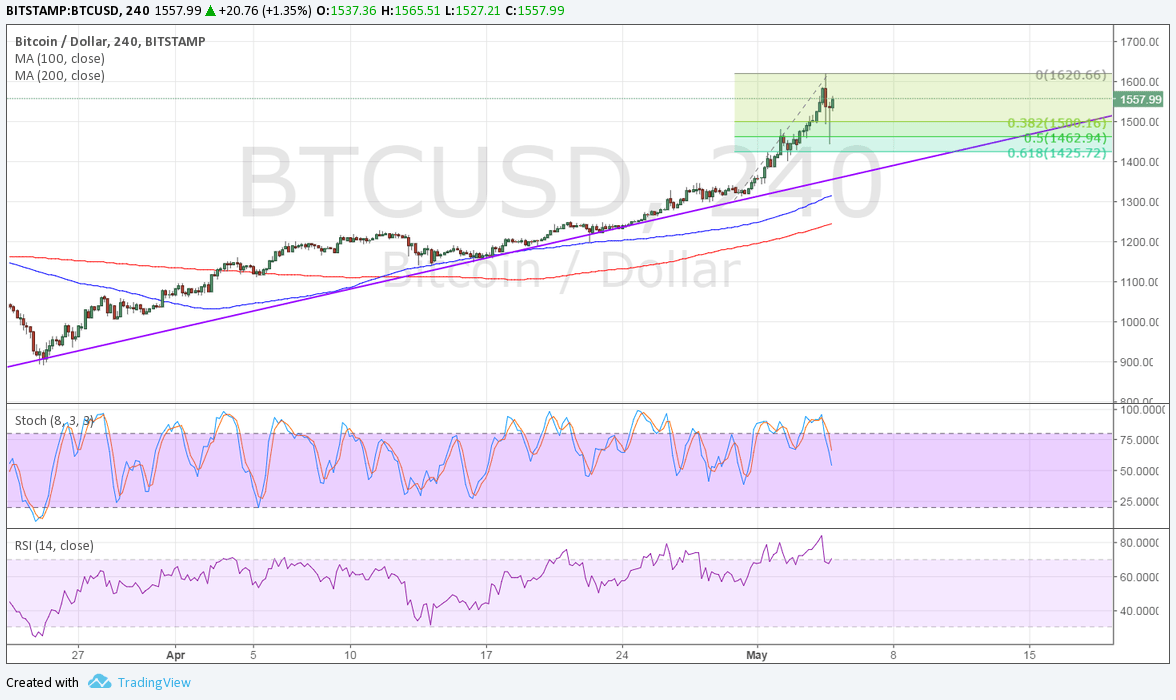
The 100 SMA is still above the 200 SMA on the 4-hour chart so the path of least resistance is to the upside. Price continues to tread further north from these moving averages to reflect increasing bullish pressure.
However, stochastic is finally turning down from the overbought zone to indicate that buyers are taking a break and letting sellers take over. Similarly, RSI is heading south so bitcoin price might follow suit.
Applying the Fib tool on the latest swing high and low on the 4-hour chart shows that the 61.8% retracement level lines up with the trend line support around $1425. Price already bounced off the 50% Fib at $1462 so there may be a pickup in bullish pressure, possibly enough to push it back above the latest highs around $1620.

Market Events
Anticipation continues to build for the SEC decision on the Winklevoss twins’ COIN bitcoin ETF as the regulator said that it is opening the door for the petitioner to submit additional evidence till May 15th. Recall that the SEC rejected the application on the grounds that bitcoin is traded in mostly unregulated markets, opening up the chance for fraud and manipulation, but Japan just made a move to recognize bitcoin as a legal form of payment.
This could encourage other regulators to take bitcoin more seriously as well, which should give the SEC enough reason to trust its legitimacy. ETF approval could lead to stronger bitcoin volumes as the market gains interest and access to the cryptocurrency.