

Bitcoin Price Key Highlights
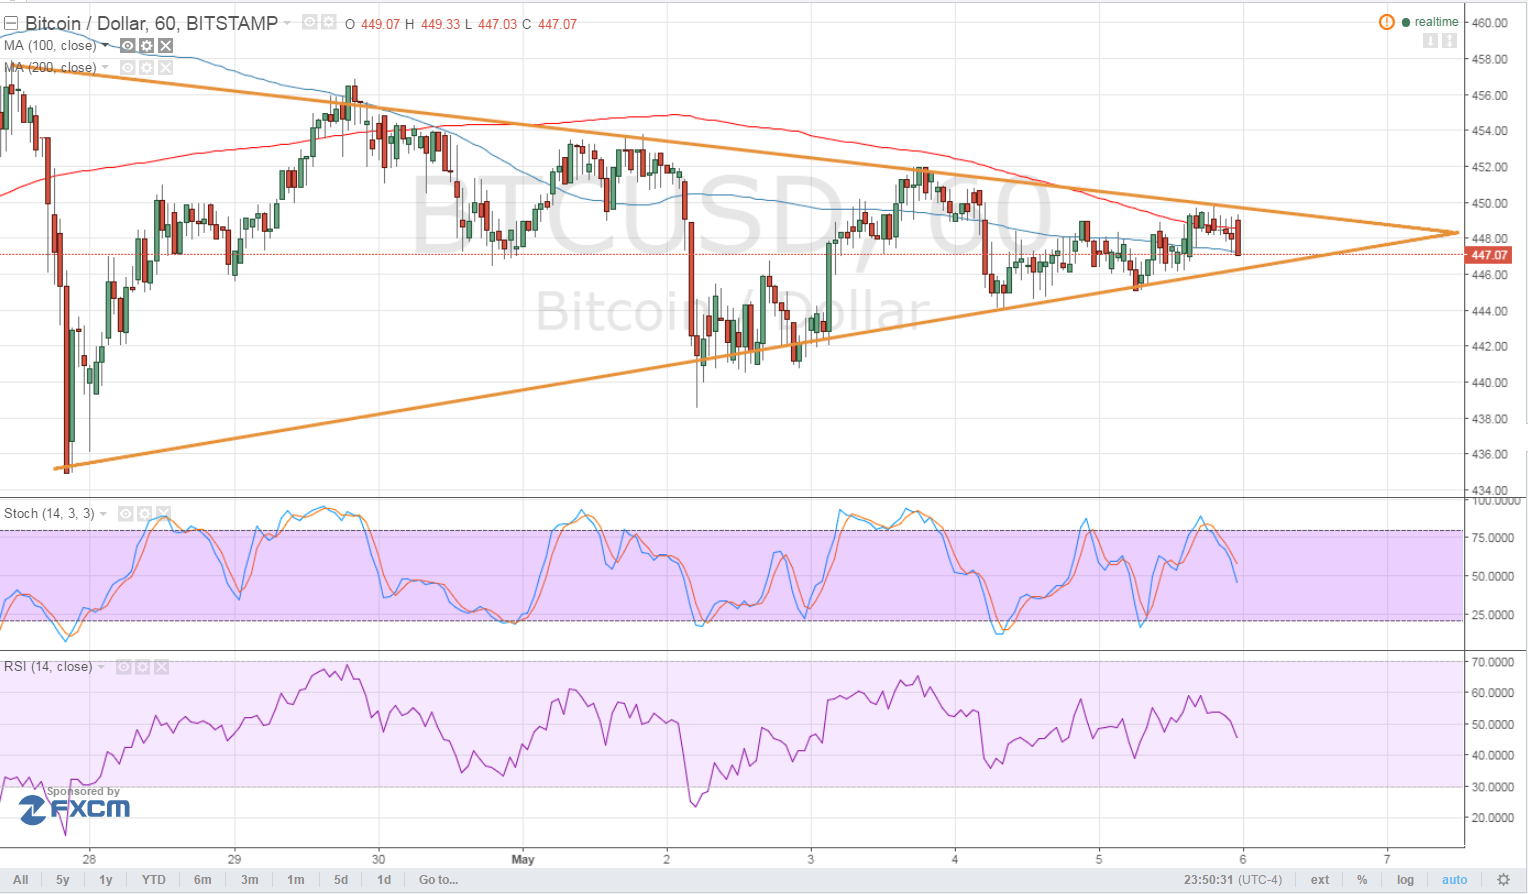
- Bitcoin price is still stuck in consolidation, moving inside a symmetrical triangle chart pattern on its 1-hour time frame.
- As expected, price found resistance at the top of the triangle pattern and 200 SMA, making another attempt at testing the bottom.
- With the top-tier events lined up from the US economy today, a breakout in either direction might take place.
Bitcoin price could be due for a breakout from the symmetrical triangle consolidation pattern, setting the next trend for price action.
Technical Indicators Signals
The 100 SMA is still below the longer-term 200 SMA so the path of least resistance is to the downside. A candle closing below the $445 level could be enough to confirm that a downtrend is set to take place. The triangle spans $435-465 so the resulting selloff could last by $30 or at least until the triangle lows.
Stochastic is on the move down so sellers are in control. RSI is also heading south, indicating the presence of selling pressure. However, if bulls suddenly take over, an upside break from the $450 level could lead to gains of roughly $30 or at least a test of the recent resistance at $470.

Market Events
The US non-farm payrolls is up for release today and many are looking to this report to see if it will convince the Fed to hike interest rates in June. Analysts are expecting to see a 203K increase in hiring, lower than the previous month’s 215K gain but still enough to keep the unemployment rate steady at 5.0%. Average hourly earnings are projected to post another 0.3% uptick.
Leading jobs indicators are giving mixed signals, with the ADP jobs report falling short of consensus while the ISM surveys reporting improvements in the jobs components. A higher than expected NFP figure could revive rate hike speculations and trigger a downside break for bitcoin price while a weak result could spur dollar losses and an upside breakout for bitcoin.
Charts from Bitstamp, courtesy of TradingView
Header Image: NewsBTC