Bitcoin Price Key Highlights
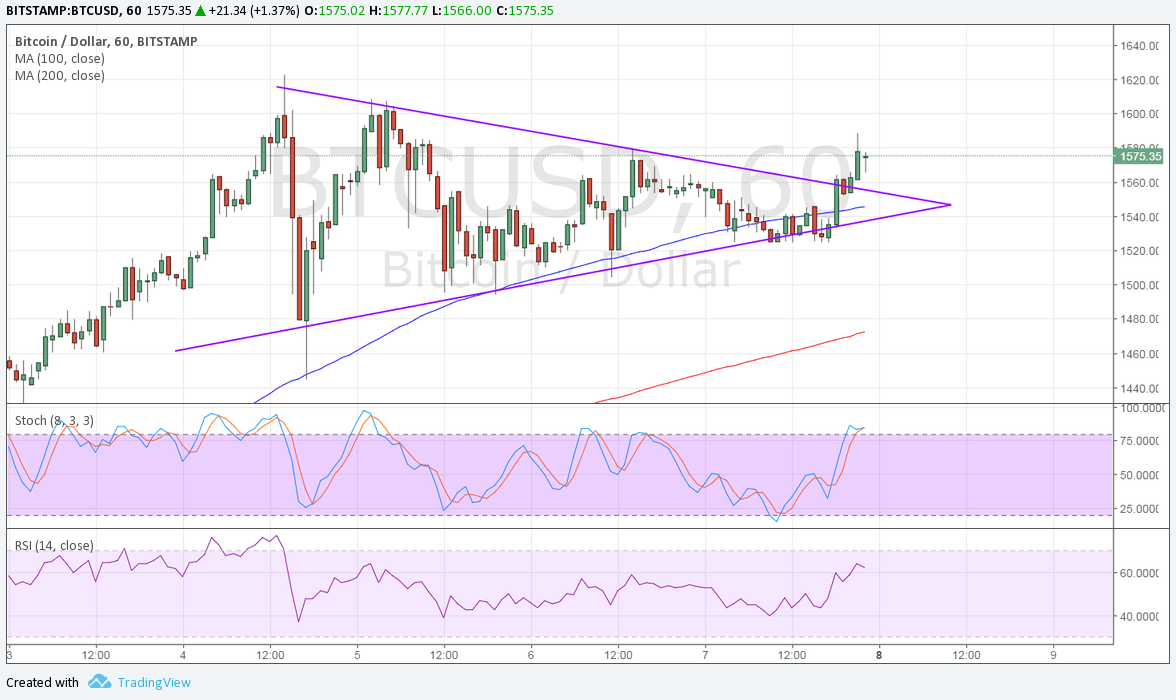
- Bitcoin price recently formed lower highs and higher lows, creating a symmetrical triangle consolidation pattern on its 1-hour chart.
- Zooming out to longer-term time frames reveals that this could be a bullish flag forming after its sharp climb.
- This chart pattern is typically considered a continuation signal and bitcoin price just made an upside breakout.
Bitcoin price could be due for more gains as it broke to the upside from its short-term symmetrical triangle pattern.
Technical Indicators Signals
The 100 SMA is above the longer-term 200 SMA so the path of least resistance is to the upside. In addition, the 100 SMA lines up with the triangle support, adding to its strength as a floor in the event of another pullback. Also, the gap between the moving averages is getting wider to reflect strengthening bullish momentum.
Stochastic is on the move up to show that there is some buying pressure left but the oscillator is nearing the overbought zone to indicate rally exhaustion. Once it turns lower, selling pressure could return and trigger a pullback to the broken triangle resistance around $1550.
RSI is also heading north so bitcoin price might follow suit. This indicator is also approaching overbought levels so buying momentum could fade at some point. However, if bulls keep charging, bitcoin price could retest the latest highs or even set new ones.

Market Events
Economic data from the US turned outs stronger than expected on Friday as the economy added more jobs than expected while the average earnings figure came in line with estimates. The Fed labor market conditions index is due today and a rise from the earlier 0.4 reading could support stronger odds of a rate hike in June.
Still, bitcoin price is enjoying support from stronger volumes in Japan as the government’s recent decision to accept the cryptocurrency as a legal form of payment has led to increase activity among investors. Expectations for SEC approval for the COIN bitcoin ETF is also driving up demand and price at the moment.