

Bitcoin Price Technical Analysis
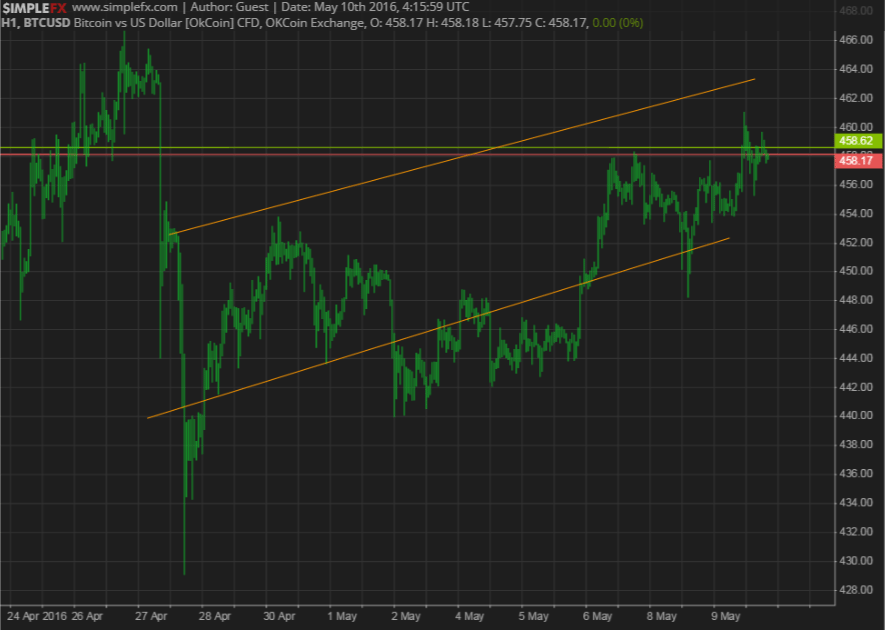
- Bitcoin price is starting to trend higher on its short-term time frame, moving inside a rising channel on its 1-hour chart.
- Price is currently testing the channel resistance around $465 and might be due for a move back towards support.
- If so, a bounce off the $450 level could be seen again. Technical indicators are looking mixed.
Bitcoin price is trending higher but might be due for a quick drop to the bottom of its short-term uptrend channel.
Technical Indicators Signals
The 100 SMA is above the longer-term 200 SMA so the path of least resistance is still to the upside. The gap between the moving averages is widening so bullish momentum is strengthening.
However, stochastic is on the move down so bitcoin price could follow suit, supporting the idea that a test of the channel support at $450 is possible. Similarly, RSI is pointing down and making its way out of the overbought area to show that profit-taking off the recent rallies is in play.
Once these oscillators reach the oversold regions, buying pressure could return and lead to a bounce back to the resistance. In addition, the nearby moving averages could hold as dynamic support levels.

Market Events
Downbeat NFP data from the US economy last week spurred a late Friday rally for bitcoin price against the dollar, as the report reminded traders that the Fed isn’t likely to increase interest rates in June. However, downbeat global data appears to have brought risk aversion back to the table and might support the safe-haven dollar against riskier assets like bitcoin.
Over the weekend, China printed a larger trade surplus but the report components showed a 10.9% drop in imports, their 18th consecutive monthly decline. This could spur yet another downturn in commodities, dragging other higher-yielding assets lower in the process.
Later on in the week, US retail sales and PPI figures are due and strong data could keep the dollar supported. On the other hand, another batch of disappointing results could lead investors to prop up bitcoin price.
Charts from SimpleFX
Image via NewsBTC Graphics