Bitcoin Price Key Highlights
- Bitcoin price continues to head further north but is currently hitting a short-term ceiling.
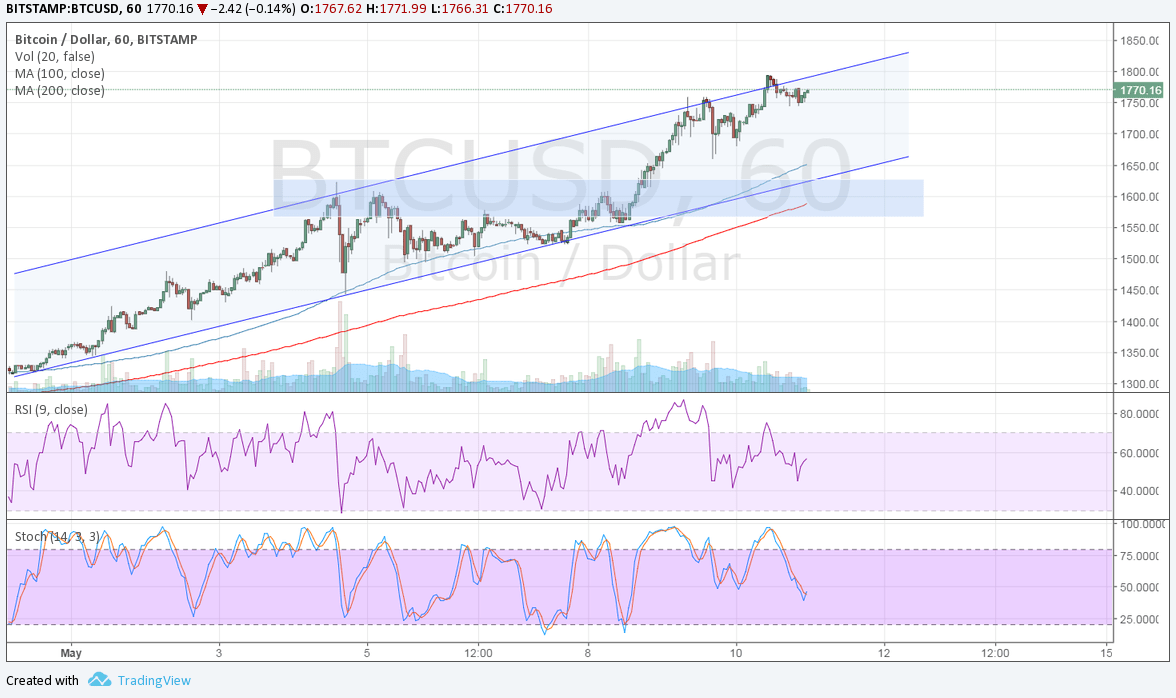
- Price is moving inside an ascending channel pattern and is showing signs of rally exhaustion upon testing the resistance.
- Volume remains elevated, which means that investor interest hasn’t waned, but it might be high-time for profit-taking and a correction.
Bitcoin price has set another record high and might be poised to keep heading further north, but it needs to draw in more bulls before doing so.
Technical Indicators Signals
The 100 SMA is above the longer-term 200 SMA on the 1-hour chart, confirming that the path of least resistance is still to the upside and that the uptrend is more likely to carry on than to reverse. The shorter-term moving average lines up with the channel support around $1600-1650, which also coincides with a former resistance level.
This could serve as a potential pullback zone in the event of a large drop due to profit-taking. Stochastic is heading down to show that buyers are taking a break and letting sellers take over bitcoin price action but it looks like the pullback is a shallow one.
A bit of bearish divergence can be seen on RSI as this oscillator made lower highs while bitcoin price had higher highs. If selling pressure picks up, a short-term drop to the channel support could be underway. On the other hand, persistent factors fueling this rally could lead to an upside break of the latest highs.

Market Events
The main factors fueling the bitcoin rally these days are: rising volumes in Japan, signs of a slowdown in China, geopolitical uncertainties stemming from North Korea and Syria, and speculations of the COIN bitcoin ETF approval.
The Winklevoss twins have been given until May 15 to submit additional requirements, during which the regulator might announce their decision after the review. Approval could pave the way for greater market interest and liquidity, thereby leading to another big boost in volumes and most likely bitcoin price. Rejection, on the other hand, could lead to a sharp selloff but this could still draw more bulls in at cheaper levels.