

Bitcoin Price Key Highlights
- Bitcoin price was previously trending higher on the 1-hour time frame, moving above an ascending trend line.
- Price made a downside break of support yesterday as the dollar surged.
- This could mark the start of a reversal from the earlier trend, although a quick correction could be possible.
Bitcoin price could be in for a downtrend on its short-term charts, as it broke below an ascending trend line.
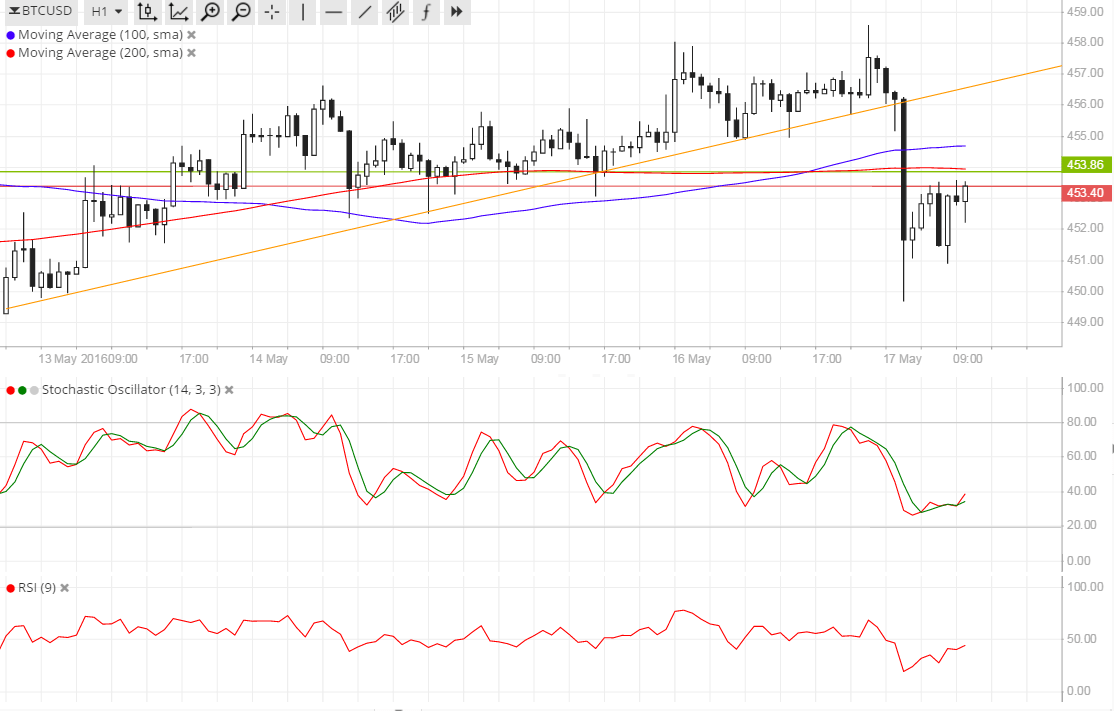
Technical Indicators Signals
The 100 SMA is above the longer-term 200 SMA so there’s still a chance for a bounce. Price rallied off the $450 level as predicted in an earlier article and might be due for a pullback to the broken support near $457.
Stochastic is indicating oversold conditions so profit-taking around these lows could be seen. RSI has moved lower during the selloff but is back in middle ground, barely offering strong directional clues at the moment. Still, the oscillator is pointing up so bullish pressure could be in play.
If the $457 area holds as resistance, bitcoin price could resume its drop to the $450 lows or aim for new ones. On the other hand, a rally past the $457 level could allow the climb back up to $470 to resume.

Market Events
Risk appetite was in play yesterday after crude oil rallied, but bitcoin price was unable to take advantage of the pickup in higher-yielding assets. Dollar strength was still in play, likely due to the downbeat figures released from China over the weekend. Retail sales, industrial production, and fixed asset investment all showed declines and weak results, renewing fears of a slowdown in the world’s second largest economy.
The main event risk for the dollar this week is the release of the FOMC minutes, which might actually draw more buyers in the mix. While the Fed refrained from hiking interest rates and signaled that they might still pause in June, a number of testimonies from FOMC members suggested that they’re still optimistic about economic prospects.
A return in risk aversion combined with upbeat Fed rhetoric could be a recipe for stronger dollar rallies and a prolonged selloff for bitcoin.
Charts from SimpleFX
Image via NewsBTC