Bitcoin Price Key Highlights
- Bitcoin price recently broke outside of its symmetrical triangle pattern and completed a pullback as illustrated in the previous post.
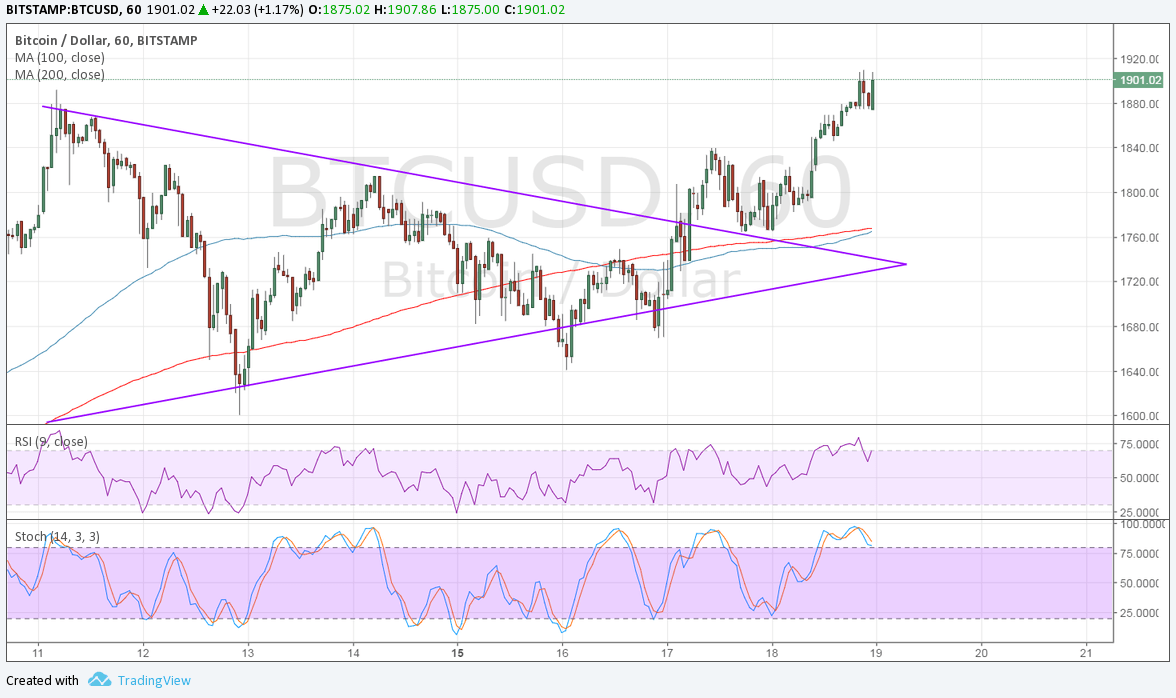
- Price has since resumed its climb and has broken past the previous highs at the $1880 area.
- Another strong bullish run is underway, supported by several market factors.
Bitcoin price has once again set new record highs upon completing its correction from the upside consolidation break.
Technical Indicators Signals
The 100 SMA is below the 200 SMA on the 1-hour chart but appears to be making an upside crossover. Once this is completed, more bullish momentum could kick in and sustain the climb in bitcoin price past the $1900 major psychological barrier onto the $2000 area.
However, RSI is turning lower from the overbought zone to reflect a pickup in selling pressure. Stochastic is also moving south so bitcoin price might follow suit. Still, this might be another correction from the ongoing rally, with the nearby area of interest located at $1800-1840. Stronger bearish pressure could take it down to the broken triangle resistance around $1750 while a reversal from the uptrend could lead to a move towards $1600.

Market Factors
Investors are keeping very close tabs on geopolitical risks again, encouraging them to move away from traditional financial markets like stocks and commodities onto alternative and higher-yielding assets like bitcoin and other digital currencies. At the same time, dollar demand has sufficiently weakened in the past few days as traders are wary of the probe into the alleged intelligence information leak from Trump to Russia.
The lack of major economic data from the US today could keep the attention fixed on the latest developments in Washington, particularly during the weekend. Any indication that Trump did leak highly-classified information to Russian officials could spur speculations of impeachment or at least a huge delay in fiscal reform, which would be bearish for the dollar and likely bullish for bitcoin price. On the other hand, headlines suggesting that no such leak was made could revive dollar strength.