

Bitcoin Price Key Highlights
- Bitcoin price has formed higher lows and lower highs, creating a symmetrical triangle consolidation pattern on its daily and 4-hour time frames.
- Price seems to have finally made a break below the triangle support, indicating that bears have taken control.
- If so, bitcoin could be due for a prolonged drop, possibly until the triangle bottoms at $350.
Bitcoin price made a downside break from the long-term consolidation pattern, signaling that a selloff is about to take place.
Technical Indicators Signals
The 100 SMA is still above the 200 SMA on the daily time frame but it has already made a downward crossover on the 1-hour chart, an early signal that a downtrend is brewing. The moving averages on this long-term chart are closing the gap, though, so a downward crossover might also happen soon.
For now, bitcoin price is eyeing the following nearby support levels: the dynamic inflection points at the 100 SMA and 200 SMA, near-term support at $400, and the next floor at $380.
Stochastic is on the move down, confirming that bears are on top of the game and that further declines are likely. RSI is still on middle ground but seems to be edging lower, also suggesting that bearish momentum is picking up.
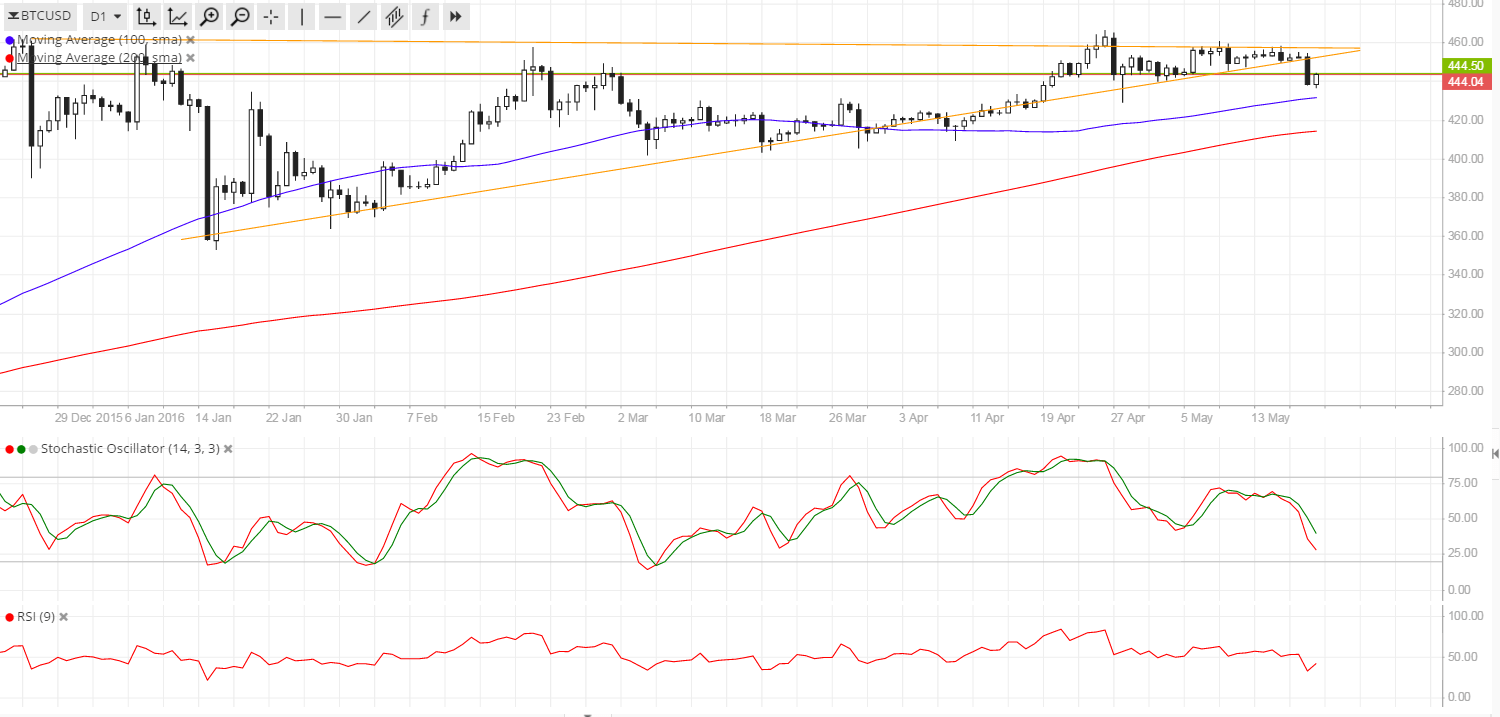

If bears aren’t quite ready to push for a sharper drop, a pullback to the broken triangle support around $445-450 could take place. But if this proves to be a fakeout, bitcoin price could still go for gains past the triangle resistance at $460 onto the longer-term ceiling at $470.
Market Events
The risk-off market environment has supported the safe-haven US dollar against bitcoin price for now, especially since the Fed is mulling a rate hike in June. Based on the minutes of the latest FOMC meeting, some policymakers are optimistic about US economic prospects, particularly when it comes to consumer spending and employment.
Testimonies from a few Fed officials have echoed this sentiment, providing additional support for the US dollar. Bitcoin, on the other hand, is sensitive to risk flows and tends to lose ground when global growth concerns are in play.
Charts from SimpleFX
Header Image via NewsBTC